Logsift
Free & open source · Windows · macOS · Linux

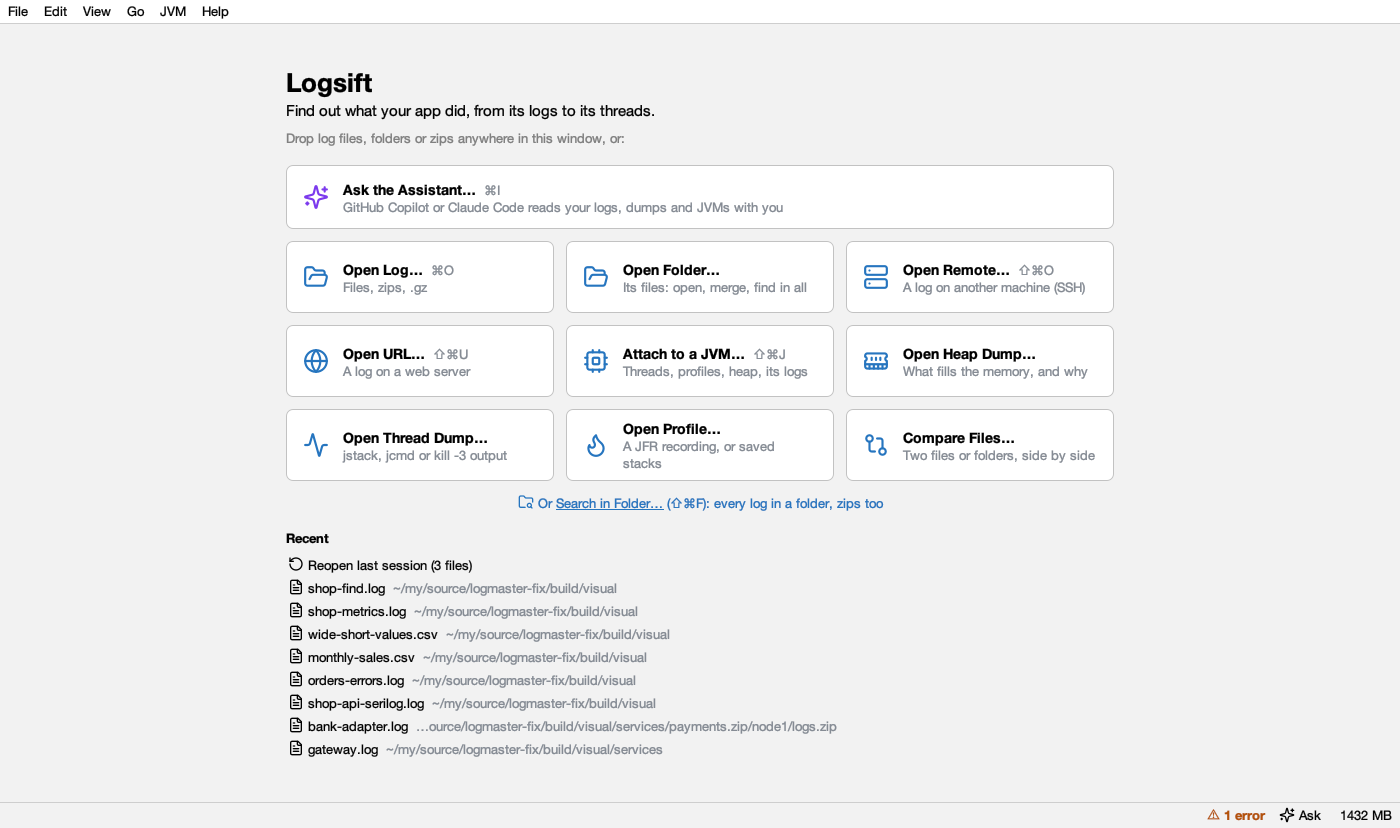
Find out what your app did, from its logs to its threads.

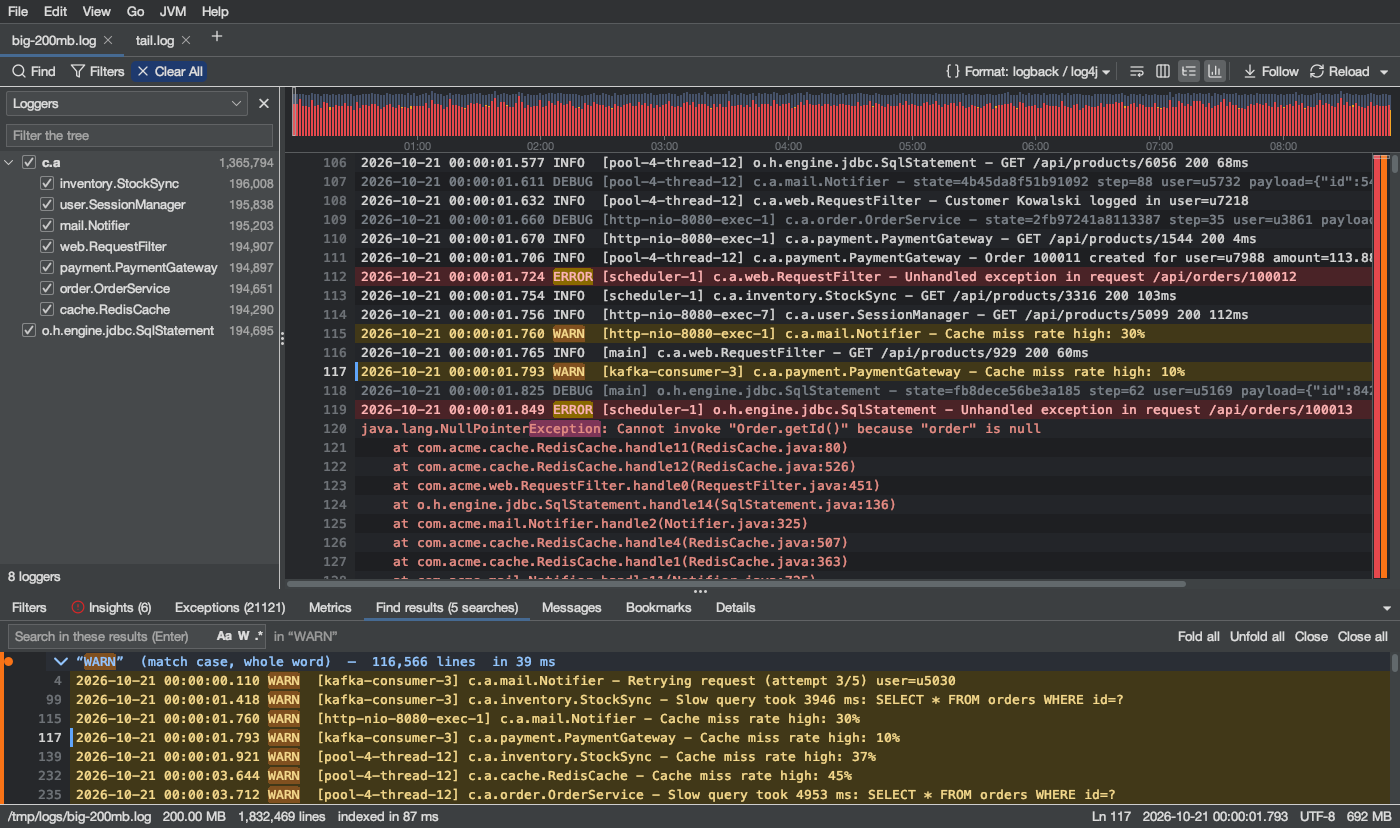
A fast desktop log viewer for gigabyte logs. Filter, follow a request, group exceptions, and read thread dumps, GC logs and heap dumps explained in plain words. Ask GitHub Copilot or Claude Code about any of it.

MIT license · no account needed · source on GitHub
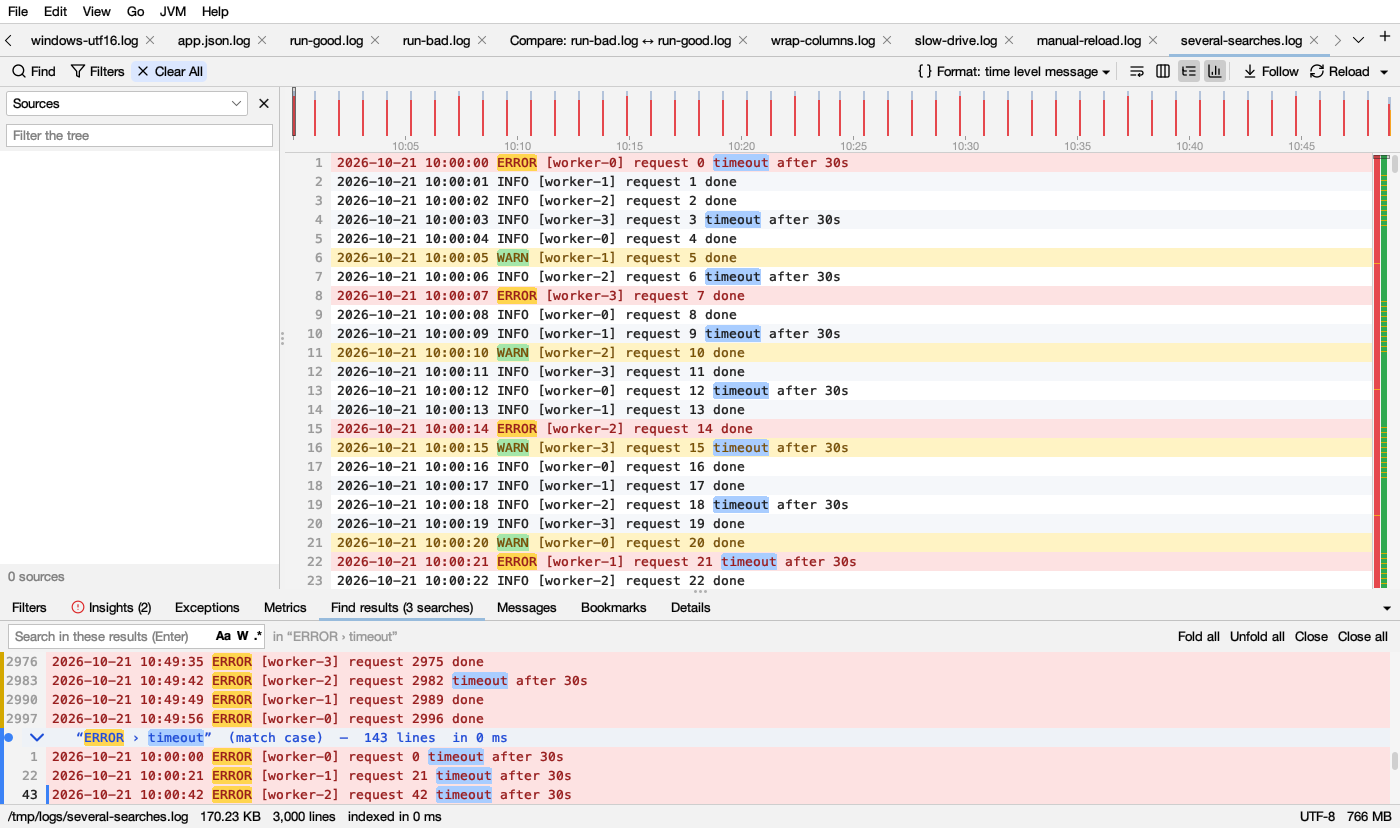
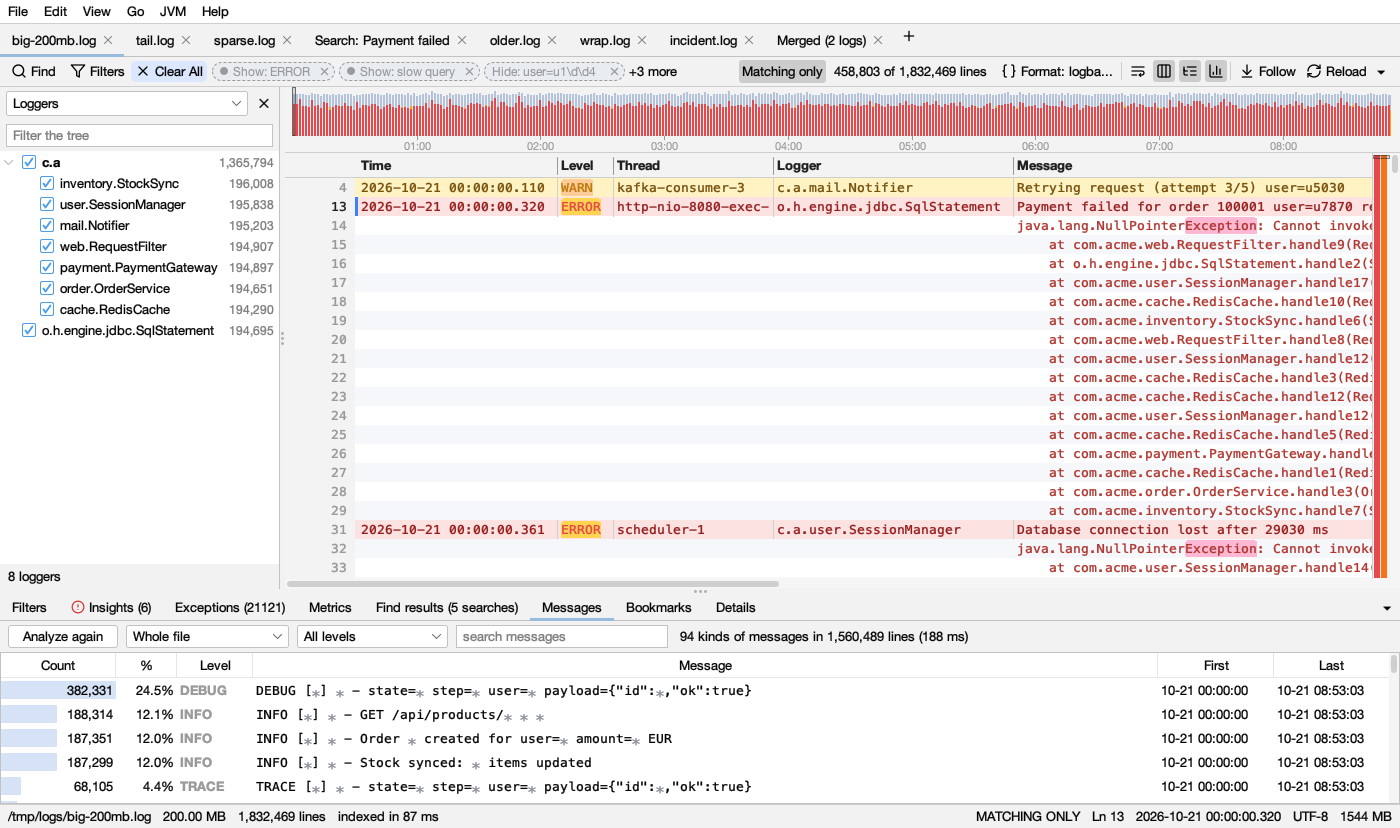
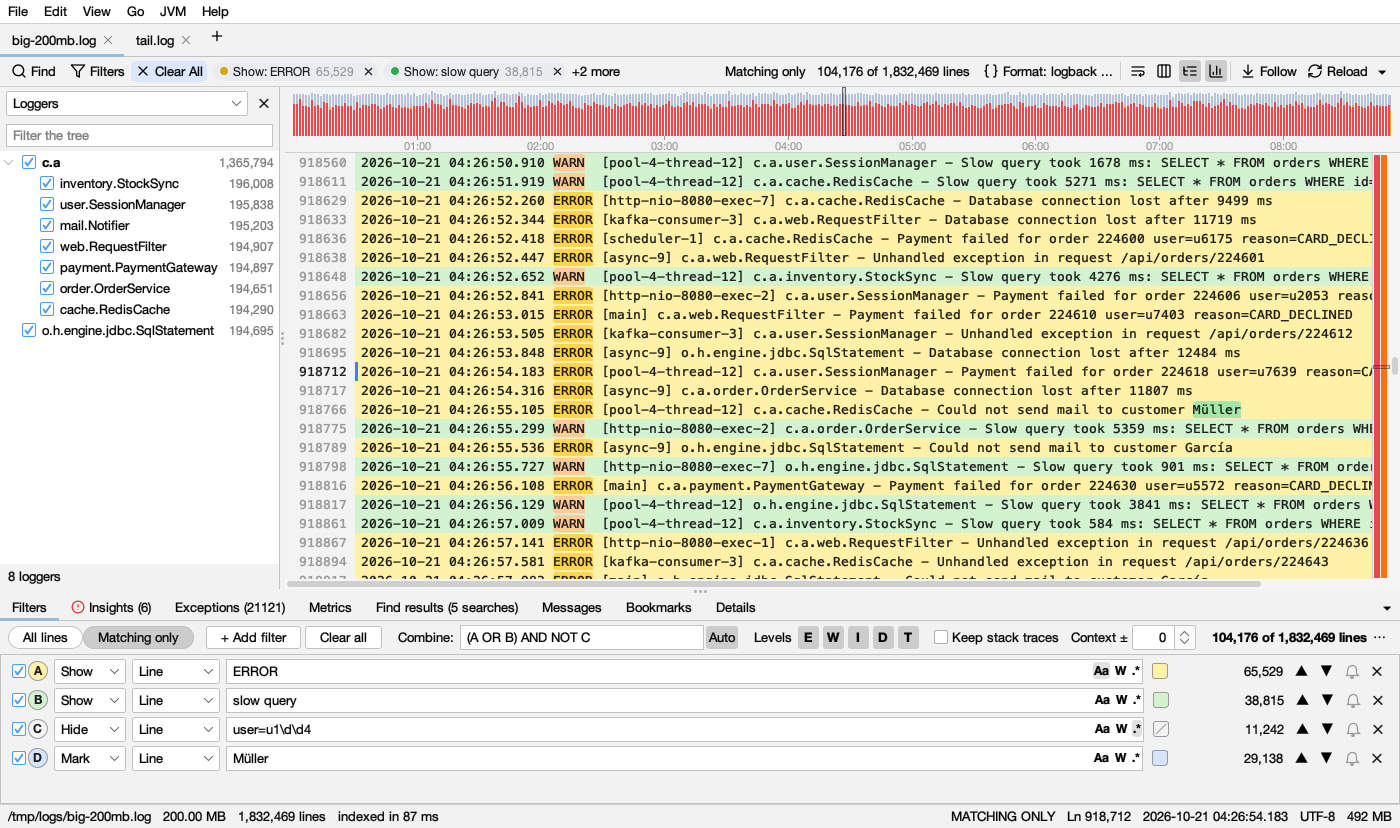
Logsift showing a 200 MB log with four combined filters, a timeline and a highlight bar
0.12 sto show a 1 GB log
0.26 sto index all of it
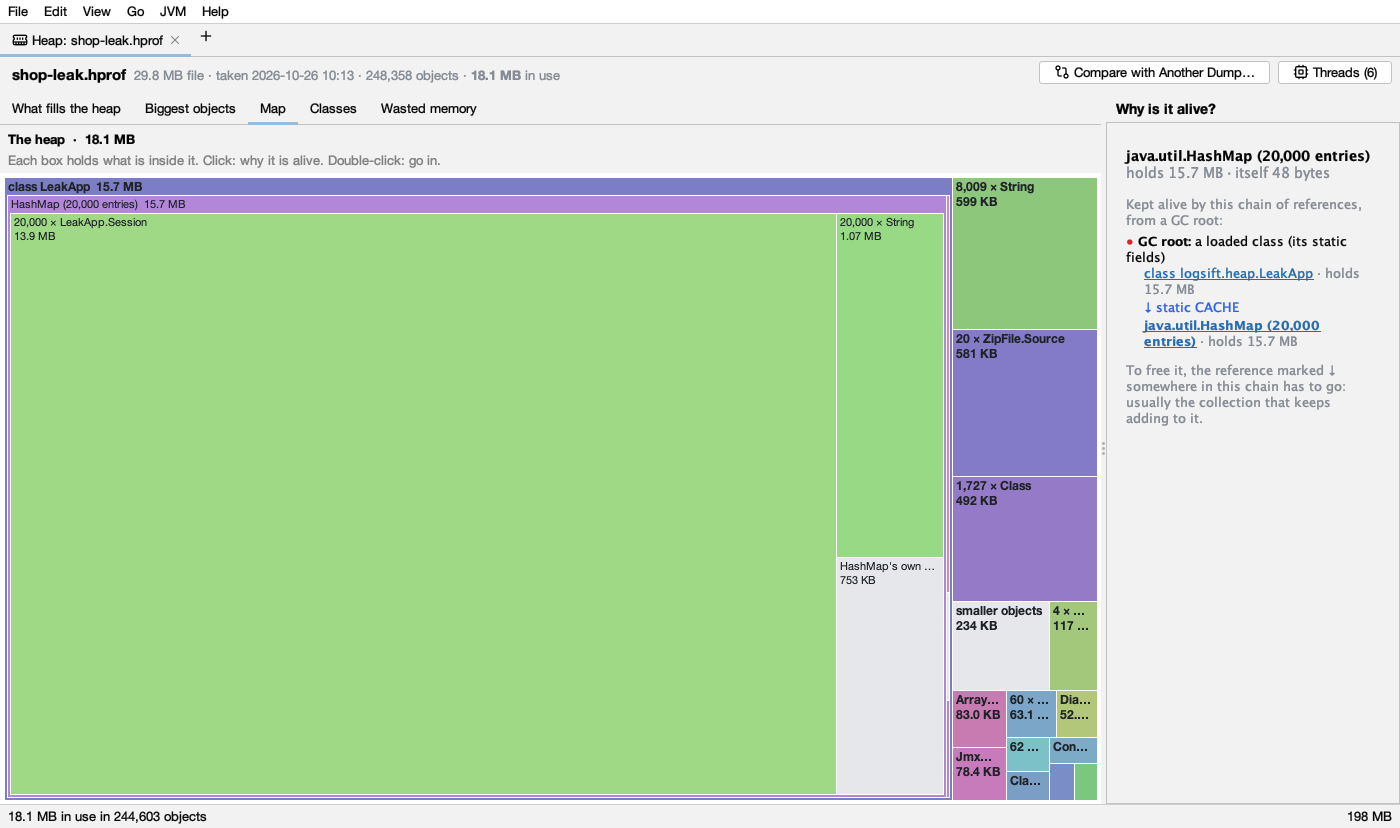
Tens of GBheap dumps, opened with 2 GB of memory
Java 8–25GC logs, every collector
Big logs

Gigabytes open instantly. Then cut them down.

Show, hide or mark lines with filters combined by AND, OR and NOT. The timeline shows error bursts at a glance; select a range to zoom in.

  • Live tail through rotation and truncation
  • Several searches at once, each in its own color
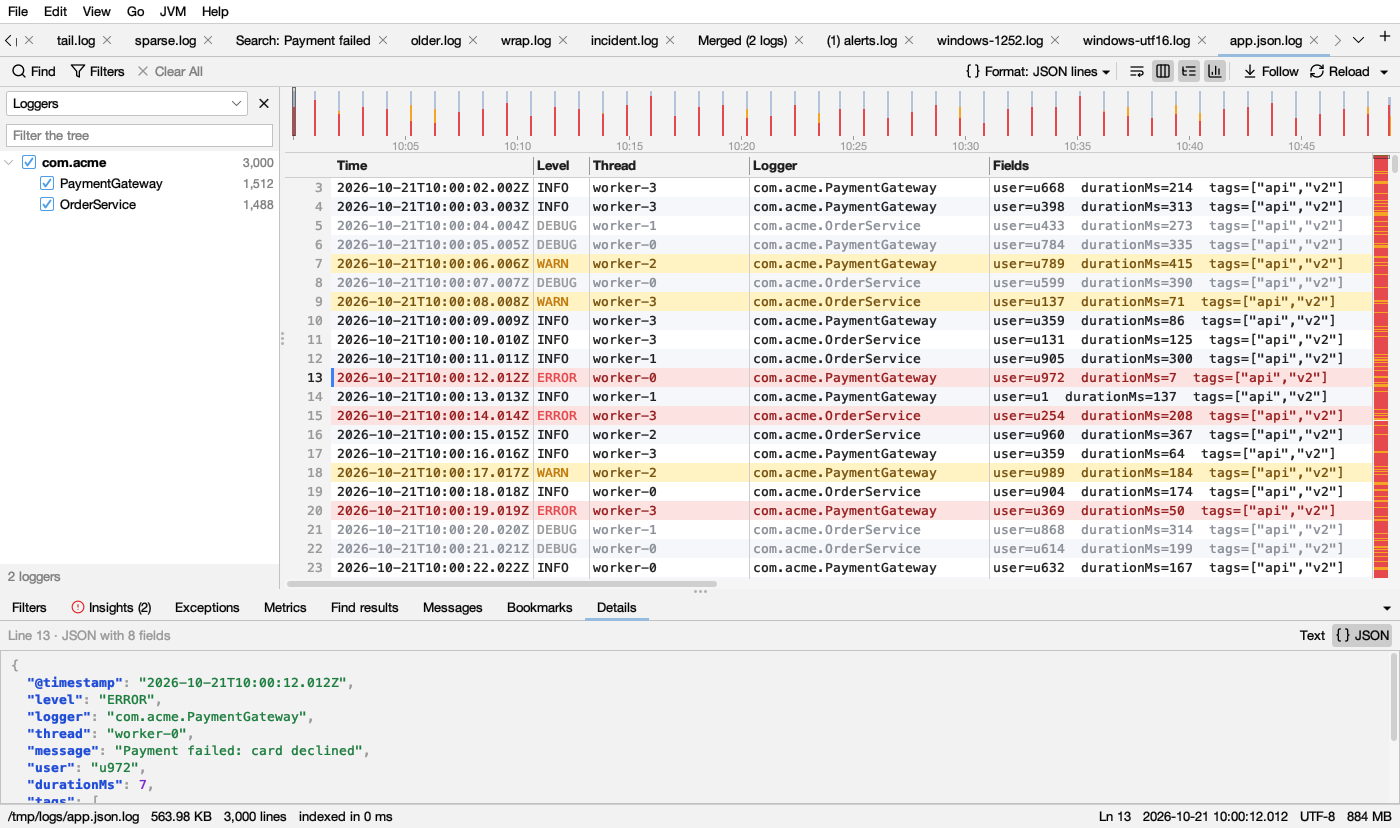
  • Columns parsed for you; JSON and CSV too
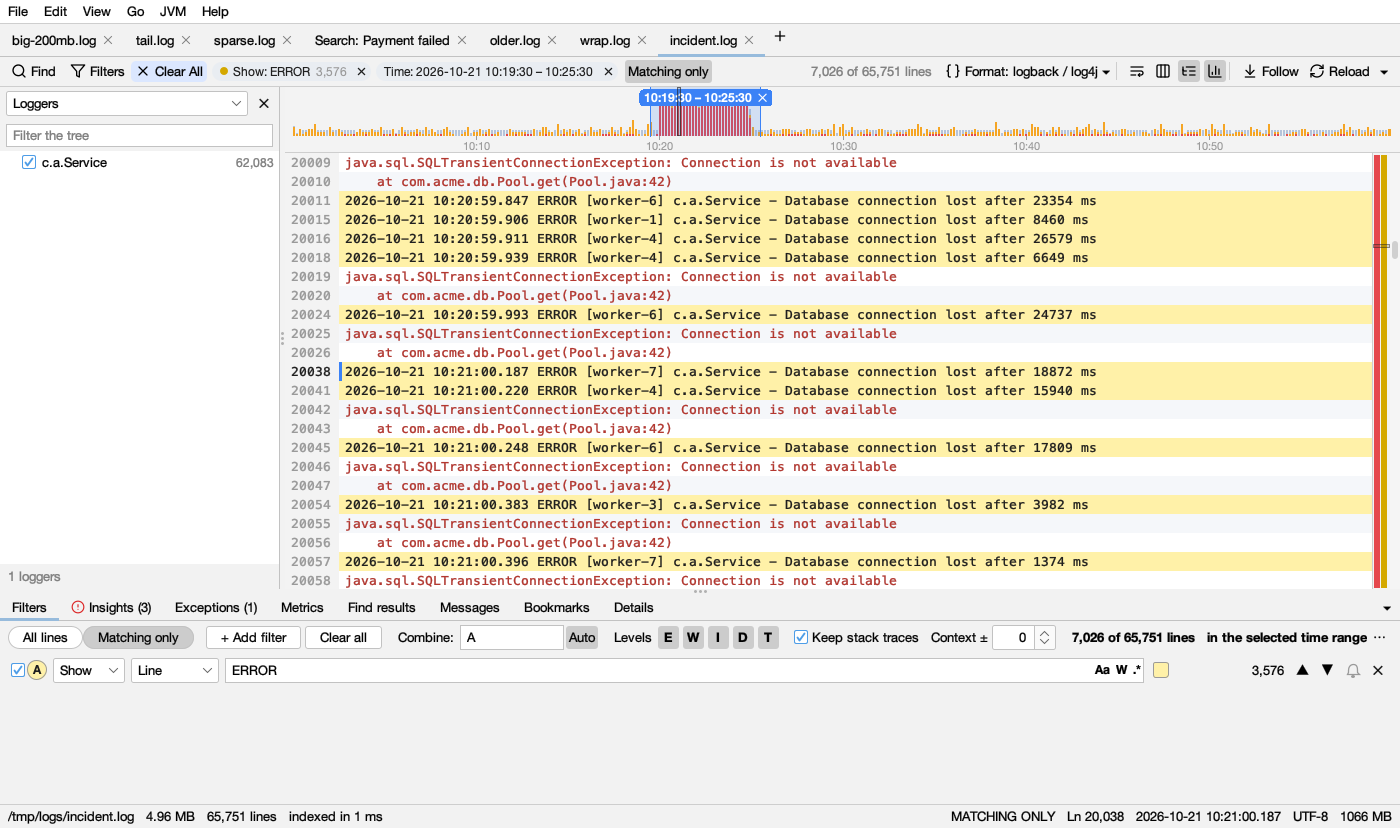
Timeline with a selected time range
Requests

Follow one request through every log.

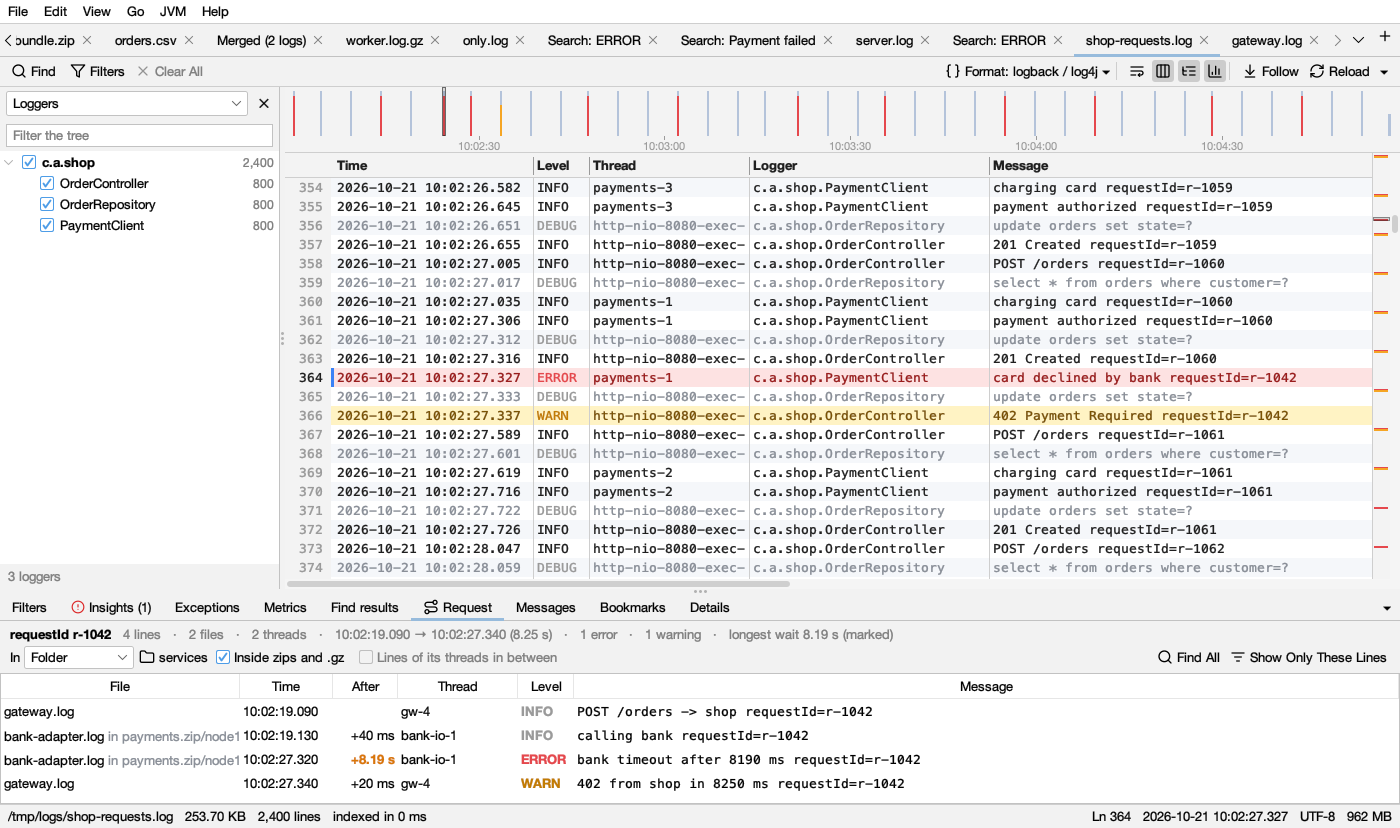
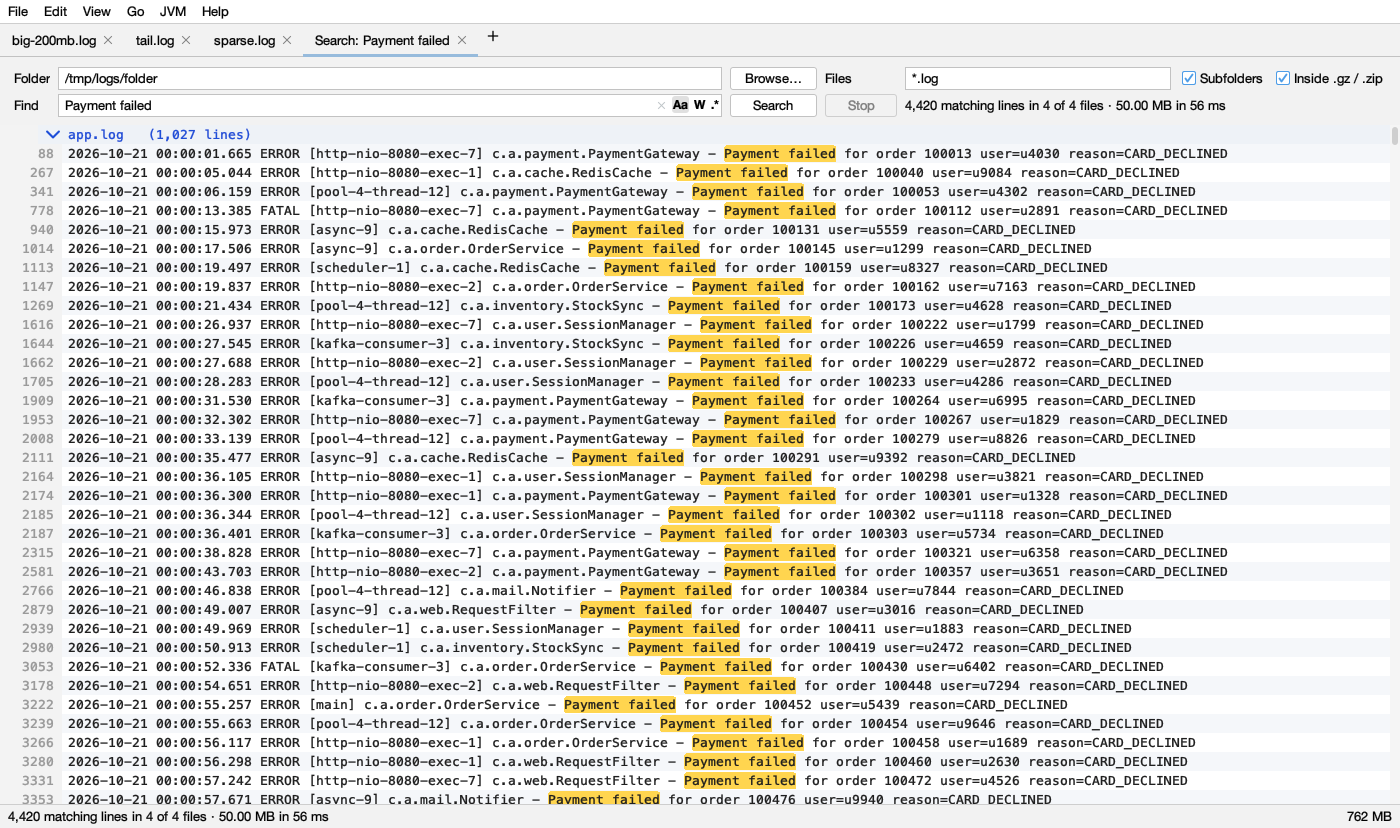
Right-click a trace or request ID: its lines in order, across threads, open logs and whole folders, inside zips too, with the longest wait marked.

  • Search folders in parallel, inside .gz and .zip
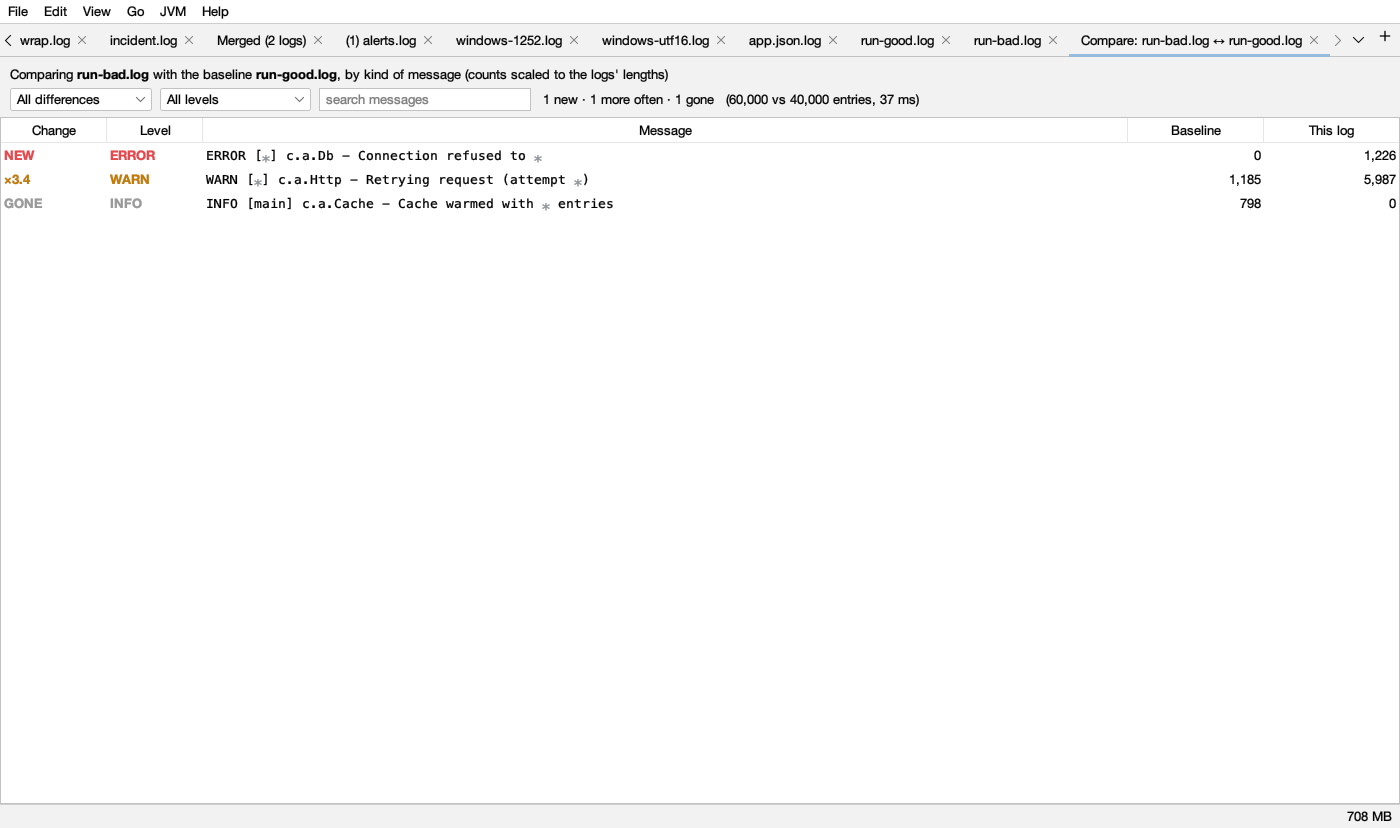
  • Merge logs by time; compare a bad run with a good one
  • Remote logs over SSH, followed live
One request followed through a folder of logs and a zip
Errors

Thousands of exceptions, a handful of causes.

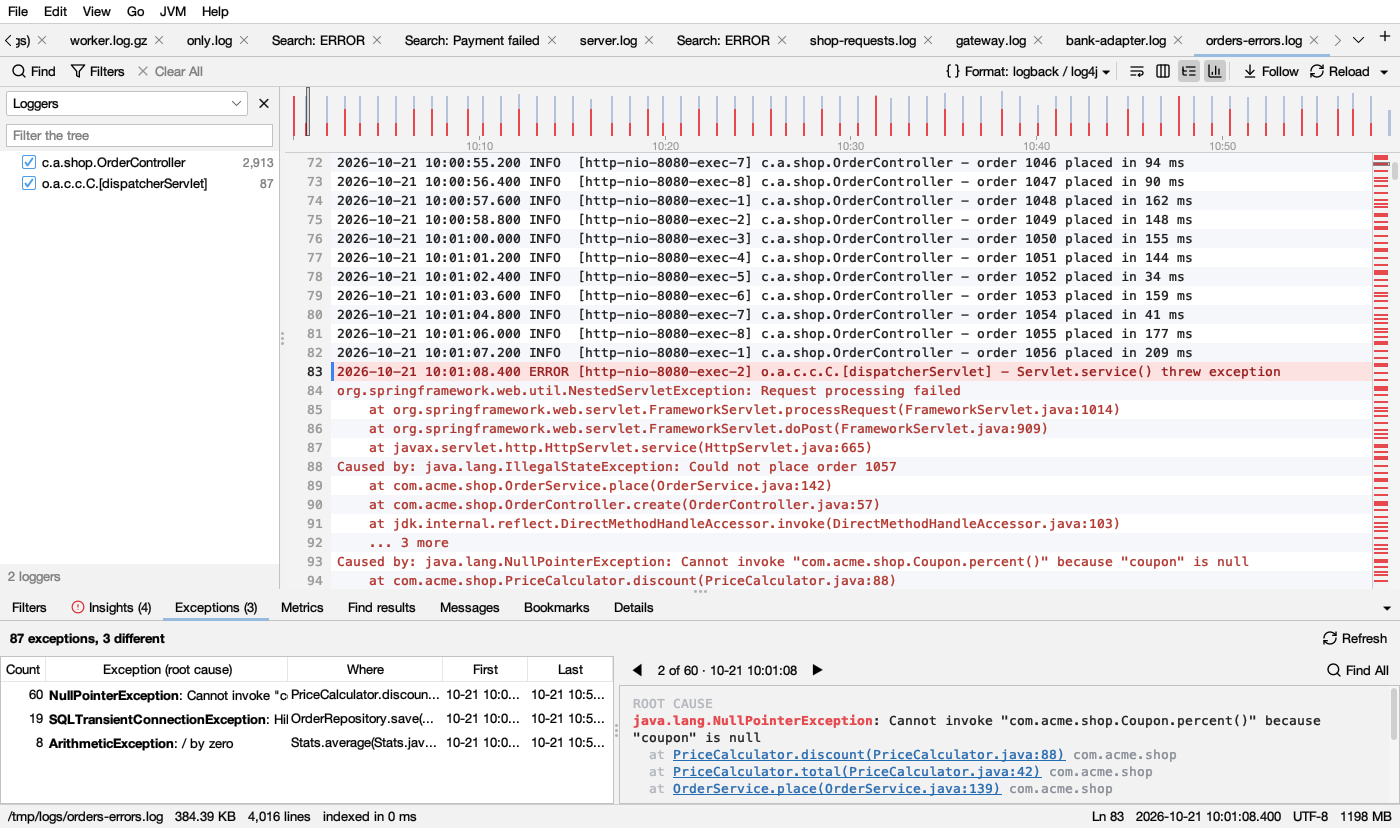
Java, .NET and Python stack traces grouped by what went wrong and where in your code. Click a frame to open it in your editor.

  • Known problems pointed out, with what to try
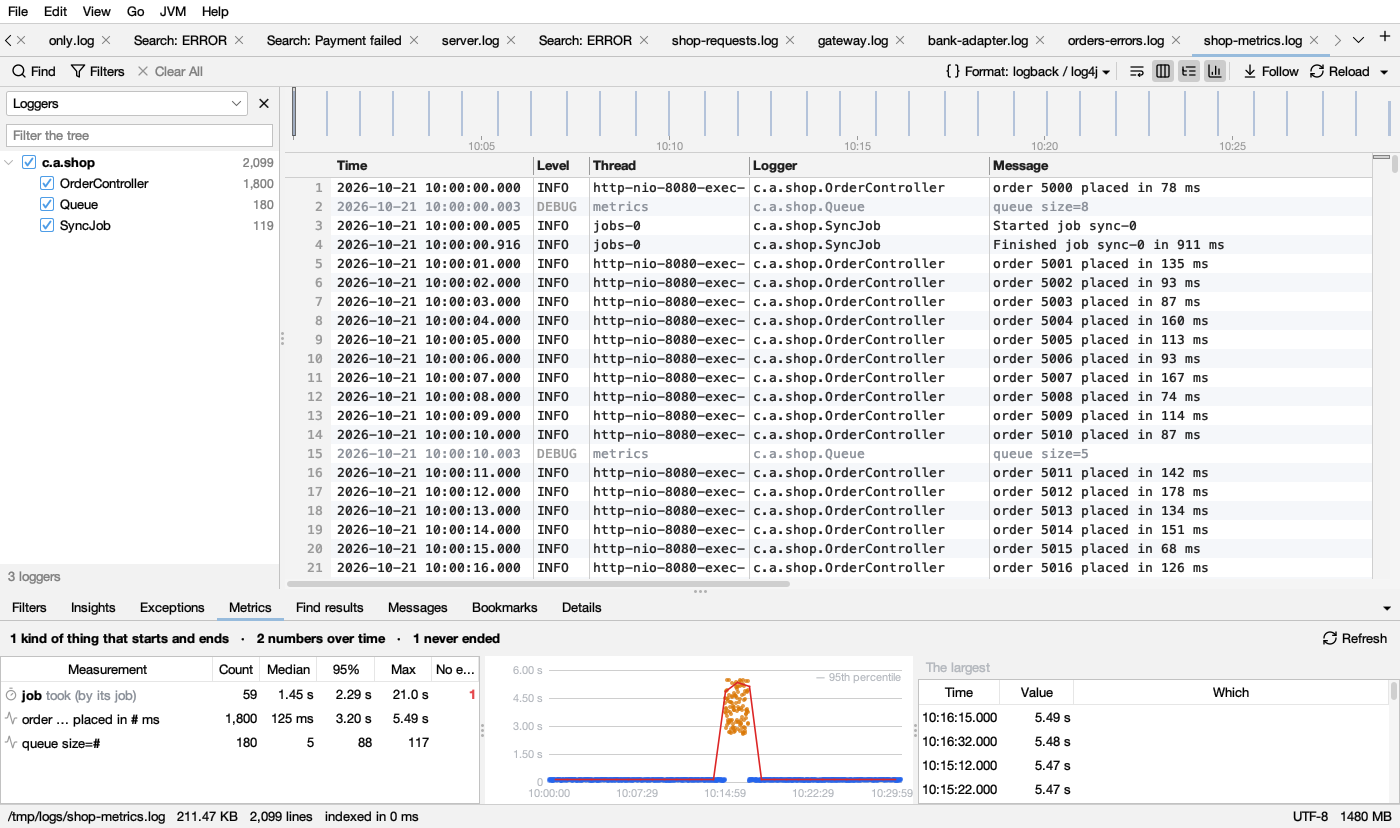
  • Durations and numbers in messages, charted
  • Insights: bursts, restarts and slow spots
Exceptions grouped by root cause, with the stack
The JVM

Threads, memory and CPU, explained.

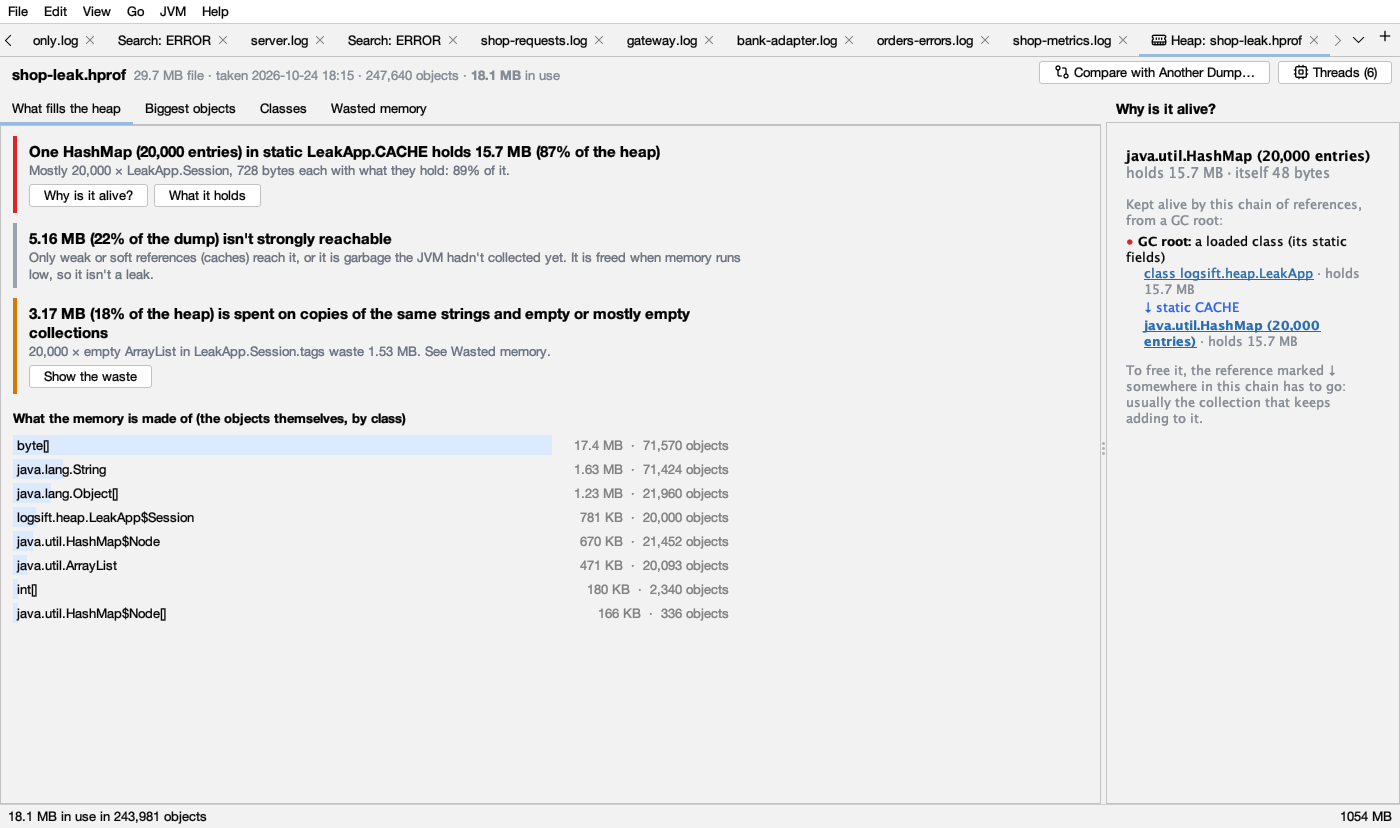
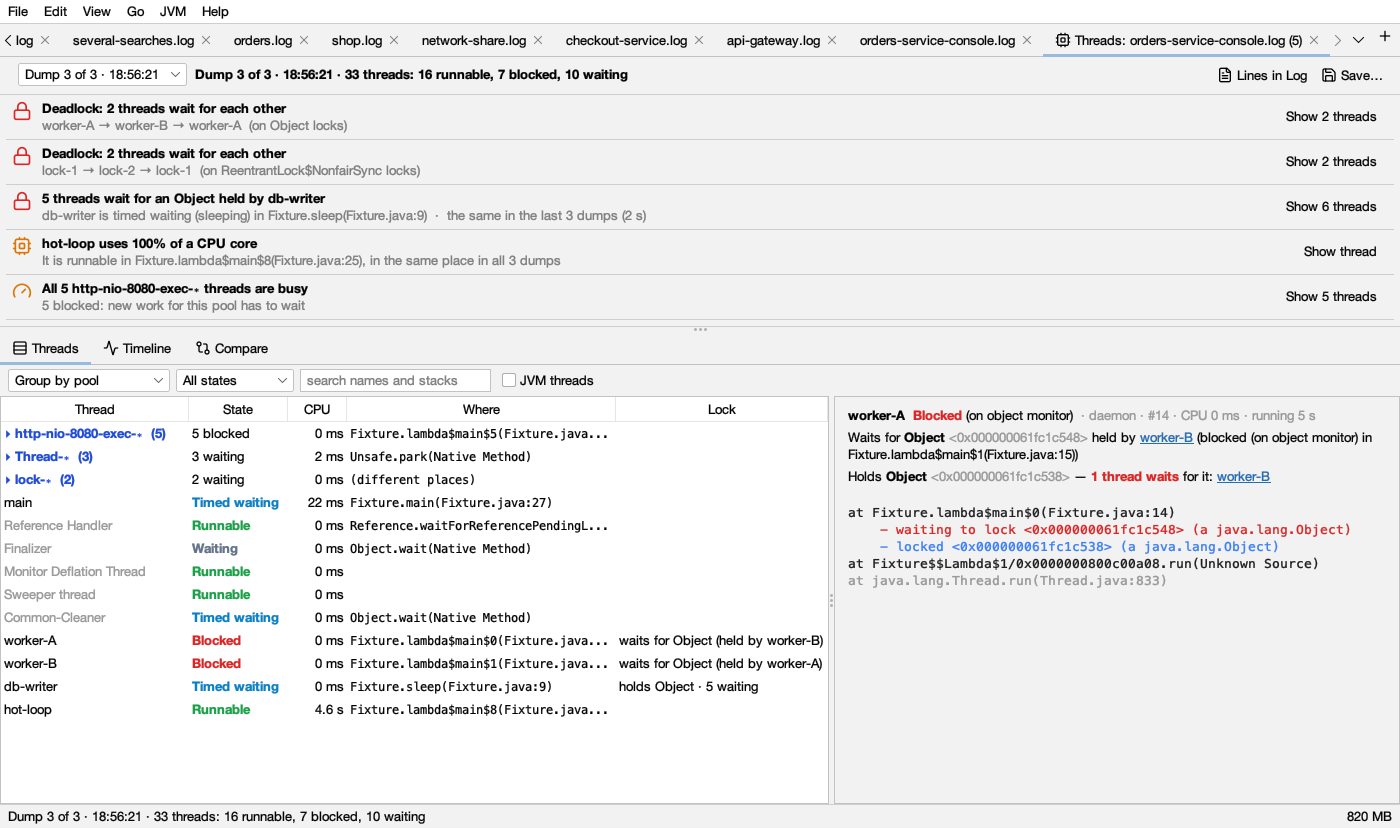
Open thread dumps or attach to a running JVM, also over SSH. Deadlocks, lock queues and stuck threads are pointed out; heap dumps say what fills the memory and why it's still alive.

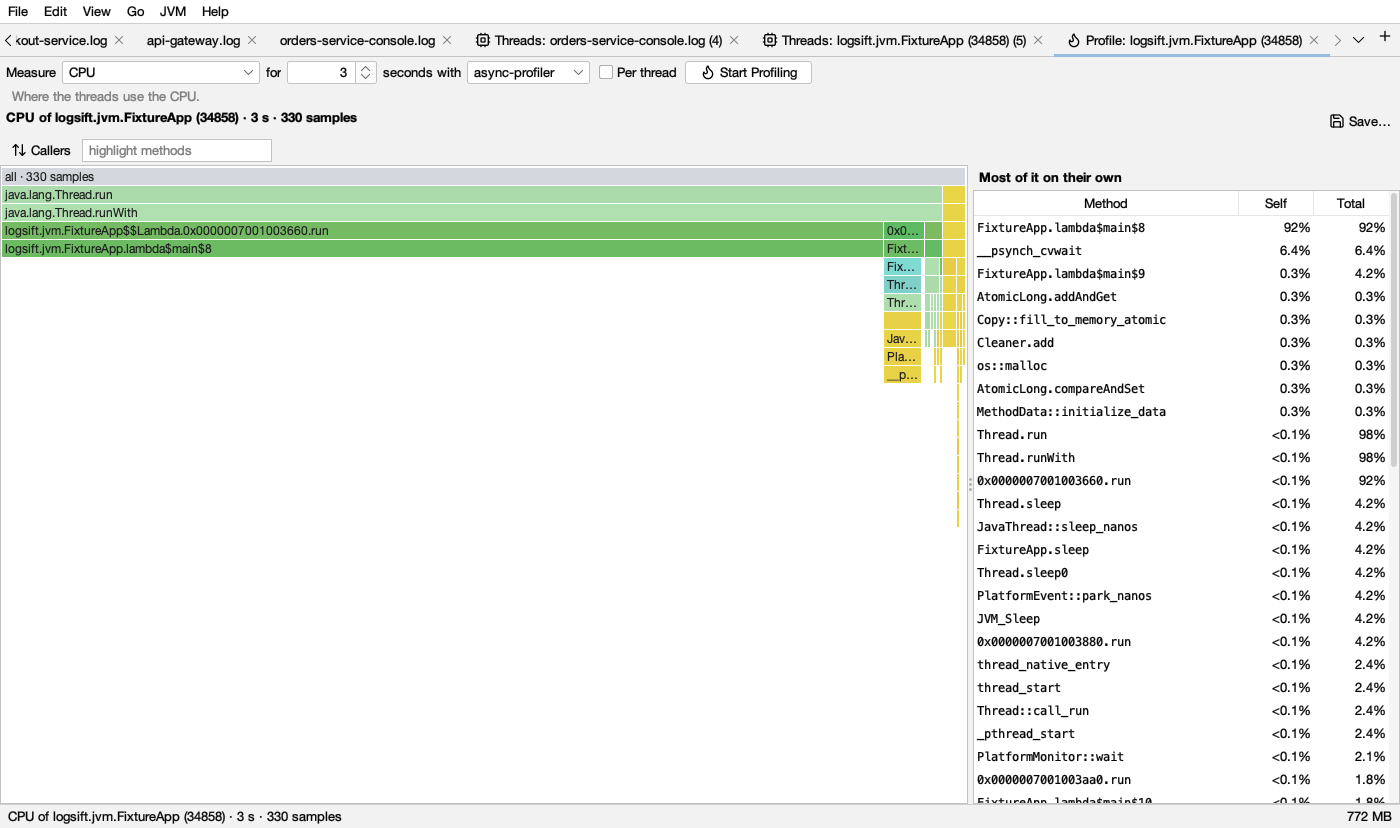
  • Flame graphs of CPU, allocations and locks
  • GC logs: the pauses, and why
  • Crash dumps and hs_err reports in plain words
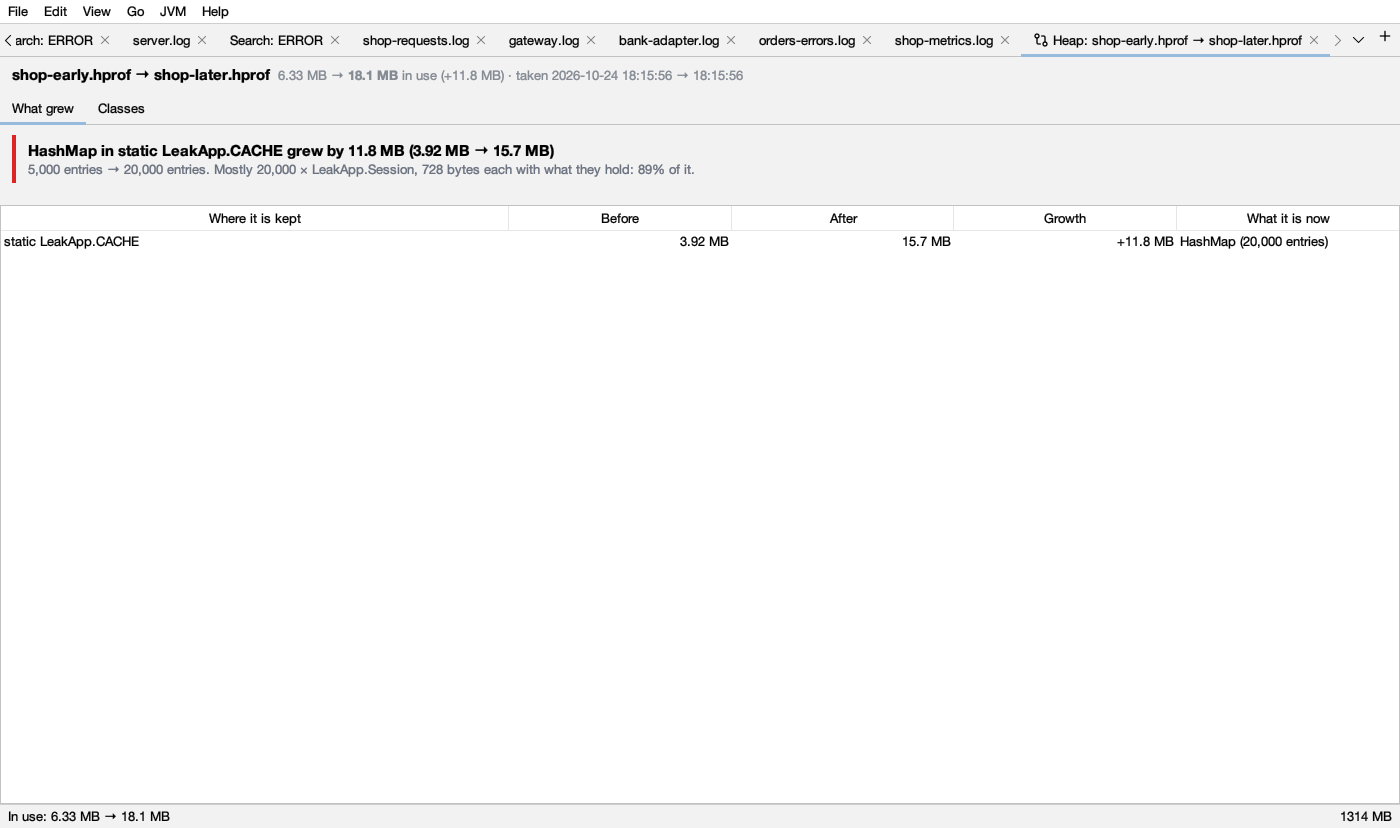
A heap dump explained, with why an object is alive
AI, with your logs

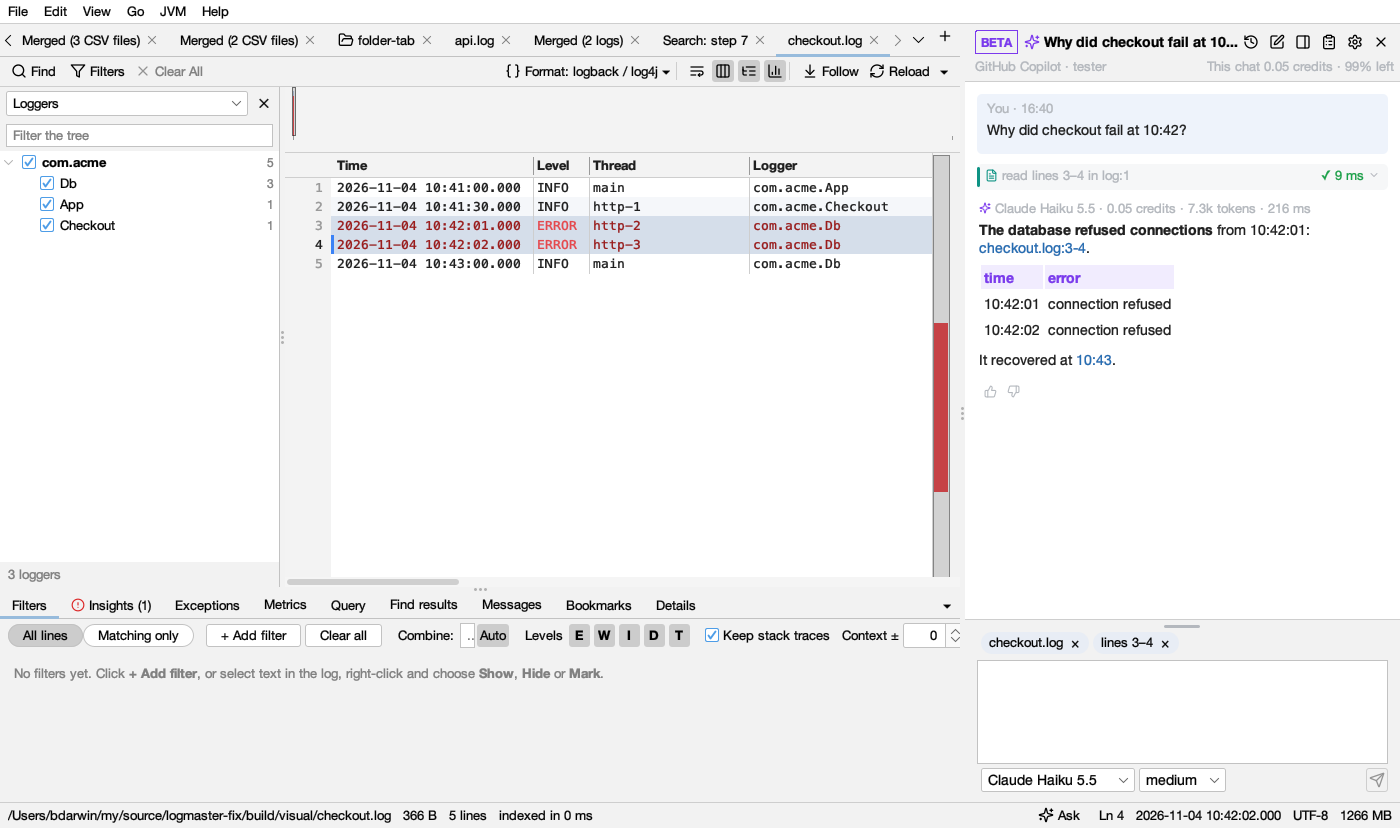
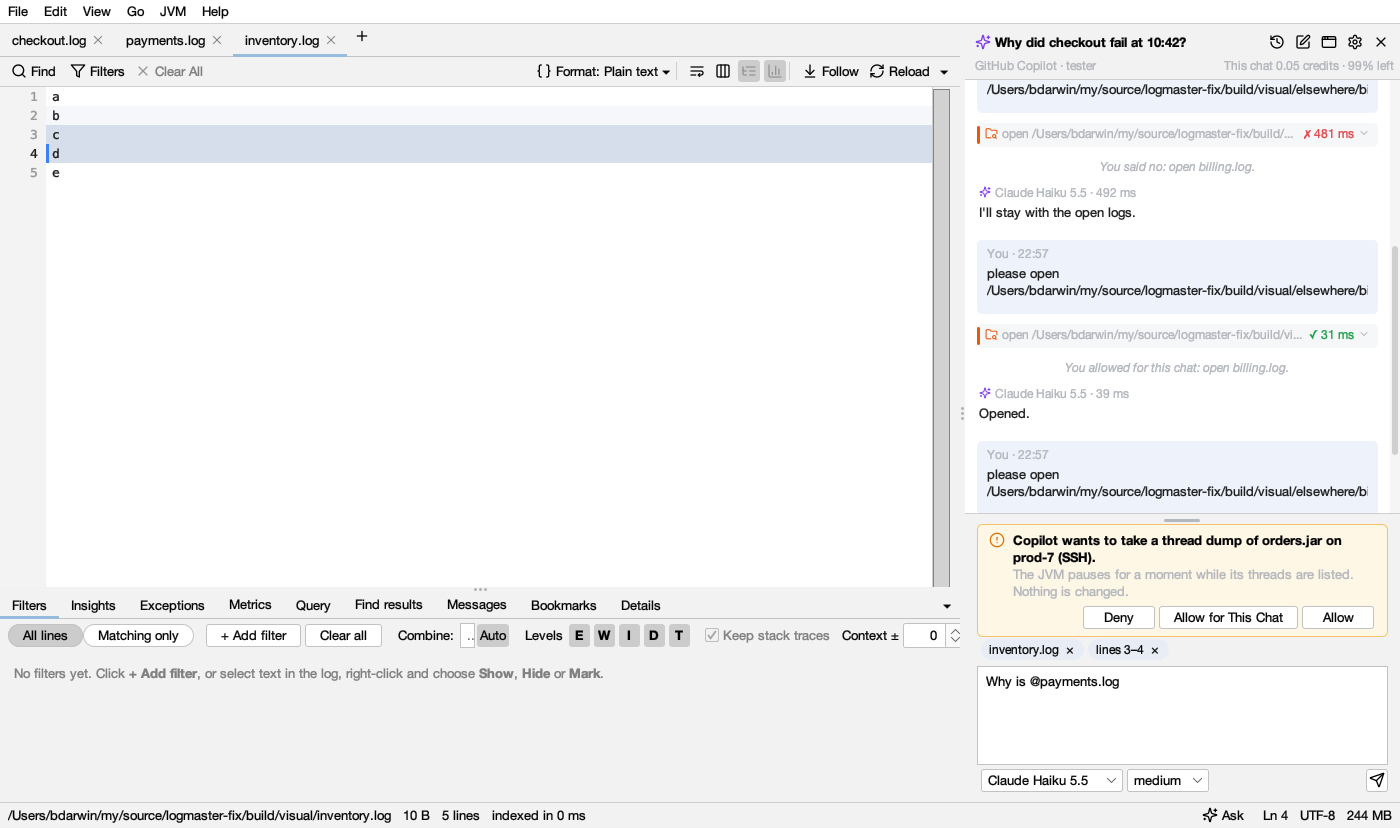
Ask why did checkout fail at 10:42?

GitHub Copilot or Claude Code answers with Logsift's own tools: it searches your logs, groups exceptions, reads thread dumps and GC logs, and cites lines you click to see. Your coding agent can ask Logsift too, over MCP.

The assistant beside a log, citing the lines it read
Answers you can checkEvery claim links to the lines it read.
The assistant asking before it takes a thread dump
It asks firstBefore it reads a file you haven't opened or reaches a running JVM.
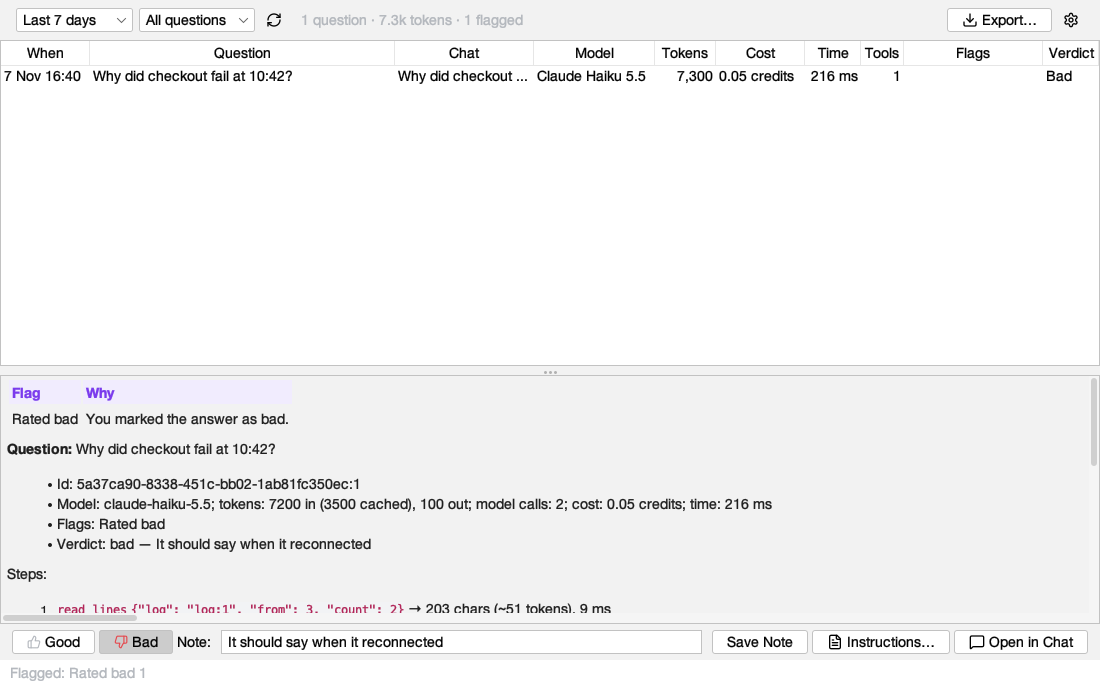
The assistant audit: each question with its tokens, cost, time and what went wrong
An audit of every answerWhat it cost, what it read, and what went wrong.
Secrets masked before they're sent Model and cost shown on each answer MCP server for coding agents

The assistant →   Coding agents (MCP) →

And more

One tool for the whole investigation.

Query with SQL

Ask a log or a CSV anything SQL can, in milliseconds over millions of lines.

Compare CSVs by key

Two exports in any order: added, removed and changed, value by value.

Pivot tables

Count, sum and average any column of a log or CSV, by month or by value.

Zips and URLs

Open a .zip to pick its files or search them all; open logs from web addresses.

A log knows its JVM

Its threads, profile and heap a click away. A line's thread opens its stack.

Light and dark

A dark mode for every view, the assistant too.

Screenshots

See it.

Your next incident, solved faster.

Free and open source. Download it, open a log, and see.

Windows (.msi, .zip) · macOS (.dmg) · Linux (.deb, .tar.gz) · any Java 21 (.zip) · all releases