Coding agents
To ask Copilot about your logs inside Logsift’s own window instead, see the Assistant.
A coding agent such as GitHub Copilot can ask Logsift about your logs. You ask in the agent’s chat, for example “why is orders.log full of timeouts?”. The agent calls Logsift, and Logsift reads the file on your computer and answers with short summaries and line numbers, never whole files. The agent can then search and read the lines around what it found.
It works with GitHub Copilot in VS Code, Visual Studio and JetBrains IDEs, with Copilot CLI, and with any other agent that supports MCP (the Model Context Protocol).
Setting it up
- Open Settings → Agents.
- Choose your agent in the Agent list. Under it, Logsift says where the setup goes and shows it, with the path of
logsift-mcpon this computer filled in. - Click Copy and paste it into the agent’s MCP settings. Merge it with what is already there.
- VS Code: choose Agent mode in Copilot Chat. Logsift’s tools are under the tools button. Copilot CLI: start
copilotagain.
logsift-mcp comes with Logsift:
| System | Where |
|---|---|
| Windows | next to Logsift.exe |
| macOS | Logsift.app/Contents/MacOS/logsift-mcp |
| Linux | bin/logsift-mcp |
| The zip for any Java | bin/logsift-mcp |
A Logsift run from a source build has no logsift-mcp, so the tab says so and Copy is off.
Other agents: add a local (stdio) MCP server called logsift that runs logsift-mcp, with no arguments.
GitHub Copilot CLI
-
Add Logsift with one command in a terminal, giving the path of
logsift-mcpafter--(see the table above; Settings → Agents shows it):# macOS copilot mcp add logsift -- /Applications/Logsift.app/Contents/MacOS/logsift-mcp # Linux (.deb; from the .tar.gz it is Logsift/bin/logsift-mcp where you unpacked it) copilot mcp add logsift -- /opt/logsift/bin/logsift-mcp # Windows (PowerShell; the installer puts Logsift in your own AppData folder) copilot mcp add logsift -- "$env:LOCALAPPDATA\Logsift\logsift-mcp.exe"Or, by hand: open Settings → Agents, choose GitHub Copilot CLI, click Copy, and paste it into
~/.copilot/mcp-config.json(on Windows%USERPROFILE%\.copilot\mcp-config.json). If the file already lists other servers, add"logsift": {…}next to them inside"mcpServers". In this file, a Windows path has each\written twice ("C:\\Users\\you\\…"). Copy does that for you.{ "mcpServers": { "logsift": { "type": "local", "command": "/Applications/Logsift.app/Contents/MacOS/logsift-mcp", "args": [], "tools": ["*"] } } } - Check it:
copilot mcp listlists logsift, andcopilot mcp get logsiftshows its command. - Start
copilot(start it again if it was running). - Ask in plain words, naming the file:
- What went wrong in ~/logs/orders.log last night?
- Why did orders fail last night? (with your log locations described)
- Group the exceptions in /var/log/app/app.log and tell me which started after 10:00.
- Is the GC in ~/gc.log healthy?
- Why did the JVM crash? ~/crash/hs_err_pid31337.log
- Explain the crash in C:\dumps\orders-service.dmp: which thread crashed and what were the others doing?
The first time it uses a Logsift tool, Copilot CLI asks whether to allow it; choose to allow it for the session (or always). Logsift’s tools only read. To skip the question, start it with copilot --allow-tool=logsift.
To remove it: copilot mcp remove logsift.
If logsift isn’t listed, or its tools fail:
- The path in
commandis wrong. Run it in a terminal:logsift-mcp --versionshould print the version. - The file isn’t valid JSON. A missing comma between two servers is the usual cause.
- What Agents Asked… (below) stays empty until the agent calls a tool. Each call is listed there.
When MCP servers are blocked: the skill
Some companies block MCP servers in their agents. Agents that support skills (GitHub Copilot CLI, Copilot in VS Code, Claude Code, and others) can use Logsift without one: the skill tells the agent to run logsift-mcp in its terminal, one tool at a time. The tools, the masking, the folders agents may read and What Agents Asked… are the same as with MCP.
- Open Settings → Agents and choose A skill, where MCP servers are blocked in the Agent list.
- Click Install for Me. Logsift saves the skill as
~/.copilot/skills/logsift/SKILL.md, where Copilot CLI and VS Code look for your skills.- Claude Code: click Copy and save it as
~/.claude/skills/logsift/SKILL.md. - For a whole project: save it as
.github/skills/logsift/SKILL.mdin the project. It names the path oflogsift-mcpon your computer, so each person’s may differ.
- Claude Code: click Copy and save it as
- Start the agent again, and ask as you would with MCP: What went wrong in ~/logs/orders.log last night? The agent asks before it runs a command; allow
logsift-mcp.
From a terminal, logsift-mcp skill prints the skill and logsift-mcp skill --install saves it (--install FOLDER saves it in FOLDER/logsift/).
The skill says where your logs are: the services you described in Log Locations for Agents, each with its folders, kinds of files, time zone and notes. Their names are in the skill’s description too, so the agent uses the skill for Why did orders fail last night? without a path. When you change the locations, Logsift saves the installed skill again. A copy you saved elsewhere by hand needs Copy again. With no locations described, the skill tells the agent how you can describe them.
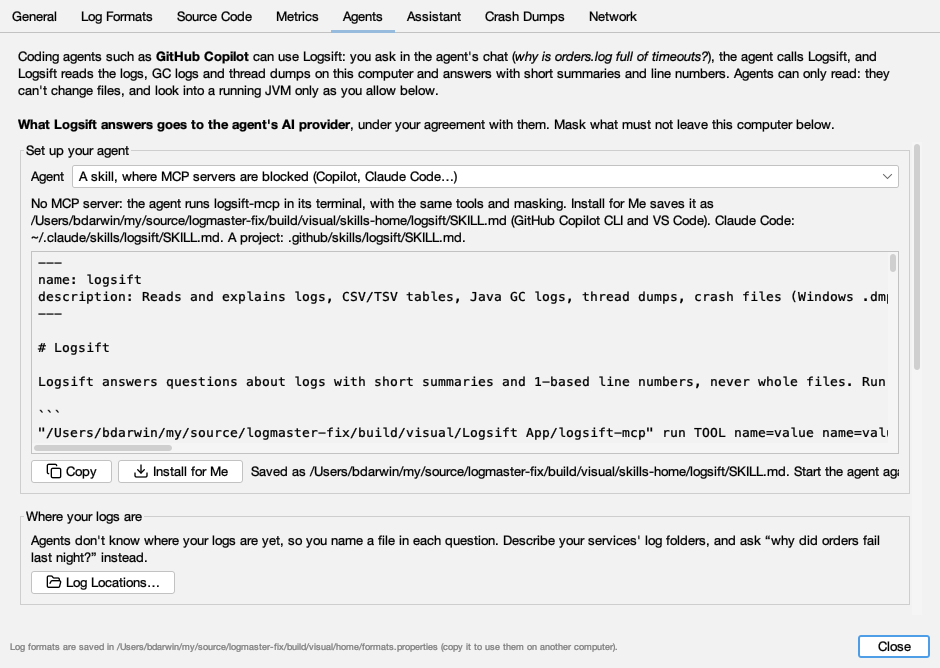
The agent runs commands like these (you can too):
logsift-mcp run insights log=~/logs/orders.log
logsift-mcp run search log=~/logs/orders.log query="timed out" limit=20
logsift-mcp run read_lines log=~/logs/orders.log from=1200 count=40
logsift-mcp tools                # the tools
logsift-mcp tools search         # one tool's arguments
logsift-mcp prompt investigate problem="orders failing since 10:00"
- Arguments are
name=value, the same names as the tools take. - For values with quotes in them, such as SQL, or with letters outside English, write the arguments as JSON to a file and add
--args FILE:logsift-mcp run query --args args.json. Or give the JSON on standard input and add-. - On Windows the skill’s commands are for PowerShell (
& "…\logsift-mcp.exe" run …); they work in Windows PowerShell 5.1, PowerShell 7 and, without the&, incmd. Logsift writes its own symbols as plain text there (<masked:secret>,",->), because PowerShell reads a program’s output in the console’s old code page. If text from your logs shows as?, run[Console]::OutputEncoding = [Text.Encoding]::UTF8first. - The answer goes to standard output. A mistake goes to standard error, with exit code 1 (the tool refused: a wrong path, a folder agents may not read) or 2 (a wrong command: an unknown tool or argument).
- Each run stands alone, so a log is named by its path (or a name from Where your logs are) every time. Slow work, such as a first look at a multi-GB log, is waited for.
~is your home folder, even inside quotes.
Where your logs are
Without help, an agent needs a path in every question. Tell Logsift where each service writes its logs, and ask “why did orders fail last night?”: the agent calls list_logs, sees that orders writes app.log (the application log, with 14 rotated copies) and gc.log in /var/log/orders, and opens the right file itself.
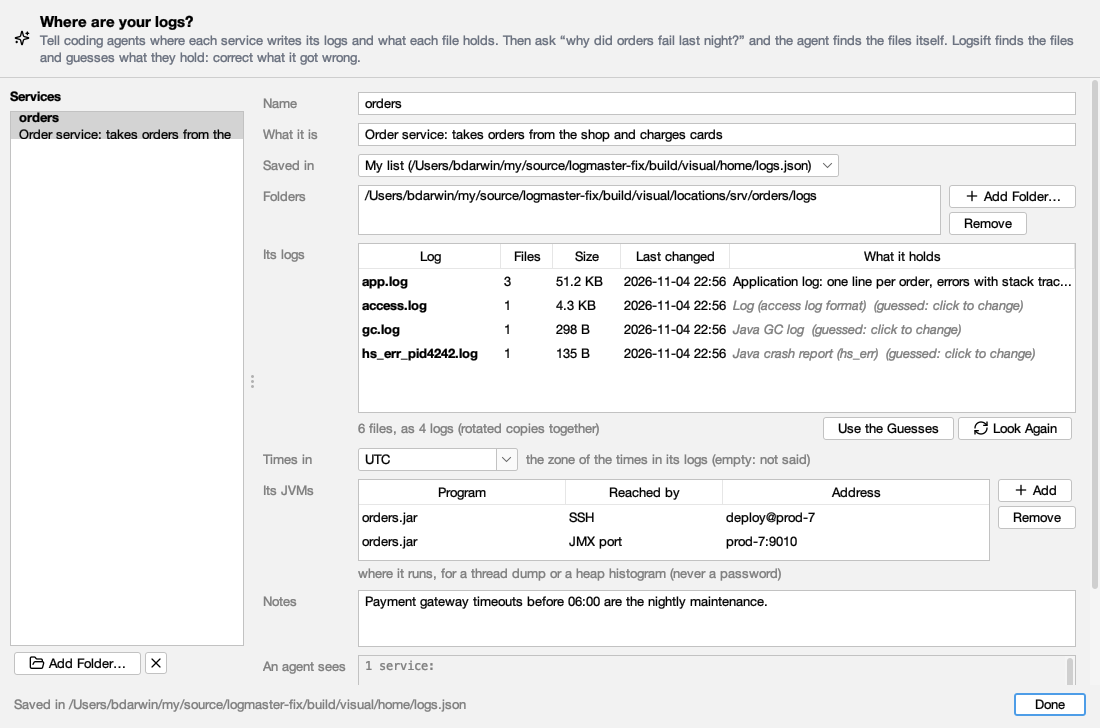
Open File → Log Locations for Agents… (it starts from the log you are looking at), Describe for Agents… in a folder’s tab, or Log Locations… under Settings → Agents:
- Add Folder… and choose the folder a service writes its logs to. Logsift names the service after the folder (the one above a
logsfolder:/srv/orders/logsis orders). - What it is: one line, such as Order service: takes orders from the shop and charges cards.
- Its logs: Logsift finds the files in the folder (and its subfolders, three deep), puts each log together with its rotated copies (
app.log,app.log.1,app.2026-10-27.log.gzare one log), and guesses what each holds (Java GC log, CSV: order_id, placed_at, amount, Log (logback format), Java crash report). The guesses are gray. Click one to say it better, for example Application log: one line per order, errors with stack traces, or Use the Guesses to keep them. - Times in: the time zone of the times in its logs, if it isn’t this computer’s.
- Its JVMs (also JVM → JVM Connections (SSH, JMX)…; Add JVM at the bottom left keeps one with no folder of logs): where the service’s JVM runs, so the assistant can take a thread dump or a heap histogram after you say yes. Add a row: what it runs (
orders.jar,com.acme.App), how it’s reached (This computer, SSH withuser@hostorhost:port, or a JMX port likeprod-7:9010ormonitor@prod-7:9010). Never a password: the list may be shared, and Logsift asks for one when it’s needed. - Notes: anything an agent should know, such as payment timeouts before 06:00 are the nightly maintenance.
- An agent sees shows exactly what
list_logswill answer.
Agents read only the folders allowed under Folders agents may read (your home folder unless you chose others). If a service’s folder is outside them, a bar says so, and Let Agents Read Them adds it.
Saved in chooses where the service is kept:
- My list:
~/.logsift/logs.json, for you. - A project’s folder…:
.logsift/logs.jsonin that project. Commit it, and your team’s agents know the logs too. Its folders may be relative to the project (build/logs). When an agent is started in that project (or below it), it reads this list as well. A service in the project’s list wins over one of the same name in yours.
Sharing with your team
The lists are written to work on other computers:
- A folder inside the project is saved relative to it (
build/logs). - A folder in your home folder is saved as
~/…. - A folder can name environment variables, each computer filling in its own:
${LOG_DIR}/orders, or${ORDERS_LOGS:-/var/log/orders}with a default. A folder whose variable isn’t set on a computer is skipped there.
Three ways to share:
- Commit the project’s list: choose Saved in → A project’s folder… and commit
.logsift/logs.json. Everyone who starts an agent in that project gets it. - Share → Copy as Text (or Copy All as Text) and send it in a chat or an email. The one who gets it chooses Share → Paste Services.
- Share → Export to a File… and Import a File…: a
logs.jsonto put on a wiki or a shared drive. Importing a service with the same name as one you have replaces yours.
logsift-mcp --logs FILE reads one more list, for example one on a shared drive. The lists are read again on each call, so changes count at once.
The file is plain JSON, if you prefer to write it by hand:
{
  "services": [
    {
      "name": "orders",
      "description": "Order service: takes orders from the shop and charges cards",
      "folders": ["/var/log/orders"],
      "files": [
        { "pattern": "app*.log*", "description": "Application log: one line per order, errors with stack traces" },
        { "pattern": "gc*.log", "description": "GC log (G1)" }
      ],
      "timeZone": "UTC",
      "notes": "Payment timeouts before 06:00 are the nightly maintenance."
    }
  ]
}
What the agent can ask
| Tool | What it does |
|---|---|
| list_logs | Your services and where their logs are (see Where your logs are): each kind of log with what it holds, rotated copies counted together, sizes and when they last changed |
| open_log | Opens a log (also a .gz file, a file inside a zip, or a web address, downloaded once to Logsift’s temporary folder), by its path or by a name from list_logs (orders/app opens the newest app.log), and gives back a short name for it (log:1), its format, size, line count and time range |
| list_open | The logs open so far |
| insights | What happened in the log, most important first (error bursts, new errors, restarts, known problems) |
| exceptions | Exceptions grouped by root cause, with counts and where they first and last appear |
| search | Lines that match a text or regex, in a range of lines if asked |
| read_lines | Lines from a line number on, or around a time (at): what another log was doing when a line was written |
| top_messages | The most frequent messages, with numbers replaced by placeholders |
| metrics | How long things took, and numbers in messages |
| query | A read-only SQL query over a log (the table log: line, time, level, logger, message, text…) or a CSV/TSV file (the table t): exact counts, groups, time buckets, percentiles. A big table comes from the app’s cache, reading only the columns the query names. tables adds other CSV files, each named after its file (customers.csv → customers), to join with. See Query |
| query_examples | Queries to start from, made for the file’s columns: the Query tab’s Examples, with those for wide tables (COLUMNS('^cpu_[0-9]+$')) |
| pivot | Pivot a table (CSV/TSV) or a log’s columns, as the Pivot tab: rows by fields (host, time:hour), columns by another, values like count, sum(ms), p95(ms), sum(cpu_*), filters and percentages. See Pivot |
| search_folder | Every file in a folder that contains a text, inside zips and .gz files too; give a service’s name to search all its folders |
| analyze_gc | Explains a GC log: pauses, time stopped, heap after collections, and what to tune |
| analyze_threads | Explains thread dumps: deadlocks, lock queues, stuck and busy threads |
| follow_request | One request, trace or order id through a log, several logs or a service’s folders: its lines in time order, the threads, the errors, the longest wait |
| merge_logs | Several logs merged by time into one (a temporary copy, never next to your files), to search and query together |
| analyze_profile | A profile (a .jfr recording or collapsed stacks): the hottest methods, your own code’s share, the hottest stacks |
| compare_files | Two files (paths, open logs or web addresses): CSV/TSV as tables matched by a key (added, removed and changed rows, old → new), only the rows where says if asked (region = EU and amount > 100), anything else line by line (times, numbers or IDs masked if asked) |
| compare_folders | Two folders or zips, file by file: the same, different, only on one side |
| compare_logs | A bad run against a good one, by kinds of message: new, gone, much more or less often |
| analyze_crash | Explains a crash file: a Windows dump (.dmp, .mdmp) or a Java hs_err_pid file. What happened, the code to blame, the crashed thread’s stack, what other threads and libraries may have caused it, and what to try |
| crash_threads | The threads of a crash file with their stacks, threads with the same stack together; filter by name, state or function |
| crash_modules | The DLLs or shared libraries loaded in the crashed process, with versions and paths |
| list_jvms | The JVMs to look into: where you said each service’s JVM runs (Its JVMs), and those running on this computer, each with a handle (jvm:1) |
| thread_dump | A thread dump of a running JVM, after you say yes: its threads by state, deadlocks, who blocks whom, the biggest groups doing the same. The whole dump becomes a log to read |
| heap_histogram | A running JVM’s objects counted by class, as you allow (asked by default), without a full GC: what takes the memory. Refused on a heap bigger than you allow (8 GB) |
| heap_dump | A heap dump (.hprof) of a running JVM, asked every time (or never, as you choose), saved in ~/.logsift/heap-dumps for analyze_heap_dump. Refused on a heap bigger than you allow, or without room for it |
| analyze_heap_dump | Explains a heap dump file (.hprof) as the Heap Dump tab does: what fills the memory in sentences, the chain of references that keeps it alive, memory that isn’t strongly reachable or is wasted on copies and empty collections, the biggest classes. A big dump takes a while: the agent is told to ask again. Logsift reads dumps you have; it never takes one |
| network_check | How Logsift reaches the internet: its proxy setting (automatic, manual or none), the proxy GitHub and a web address go through, and with test whether GitHub can be reached. For when opening a log from a web address fails |
| assistant_audit | The questions asked to Logsift’s own assistant, newest first. For each one: what answering it took (the model, its calls, each tool with its arguments and the size of its answer, the tokens, the time and the cost), what was flagged (failed tools, the same call again, big tool answers, broken links, answers rated bad) and your note. Use it to find what to change. When Logsift is running, it answers this itself |
| assistant_audit_question | One of those questions in full: what went with it, each step with the start of each tool’s answer, and the answer. On request, the instructions the assistant had too |
Line numbers in answers start at 1, like in the log view. Times are the log’s own times.
From a crash file the agent gets only the explanation: stacks, modules and facts. It never gets the process’s memory that a dump holds.
Long answers are cut, and say where. Slow work, such as a first look at a multi-GB log, goes on in the background. The agent is told to ask again in a few seconds.
Ready-made tasks
Logsift also offers tasks that tell the agent how to go about a job, step by step, with which tools. It asks for evidence: line numbers, times and counts. Agents that support MCP prompts show them as commands. In VS Code’s Copilot Chat, type / and look for mcp.logsift.….
| Task | Asks for | What the agent does |
|---|---|---|
| investigate | the problem in your words, and where (optional) | Finds the logs, insights and root causes, errors over time, the lines around the first error, one failing request end to end |
| explain_crash | the crash file, and the logs around it (optional) | Explains the dump or hs_err file, the other threads and libraries, and what the logs show just before |
| compare_runs | the bad run’s log and the good run’s | What’s new or different in the bad run, and when they diverge |
| find_slow | a service or log | Durations and percentiles over time, the slowest requests followed end to end, GC and threads for Java |
| health_check | a service or log | A short report: healthy or not, and the top three things to look at |
They come with logsift-mcp, so there’s nothing else to install. Agents without prompts still get the same guidance when they connect.
Running JVMs
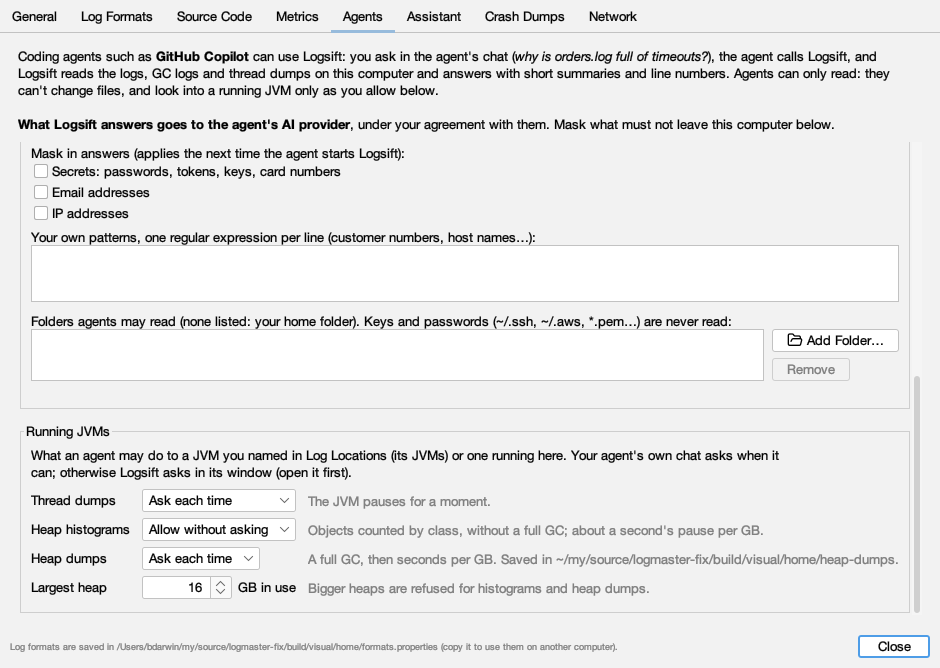
An agent can look into a JVM you named in Log Locations (Its JVMs) or one running on this computer. Settings → Agents → Running JVMs sets what it may do. The assistant and coding agents follow the same settings:
| Choices | What it does to the JVM | |
|---|---|---|
| Thread dumps | Ask each time (default), Allow without asking, Never | A pause of a moment |
| Heap histograms | Ask each time (default), Allow without asking, Never | Objects counted by class, without a full GC: about a second’s pause per GB of heap |
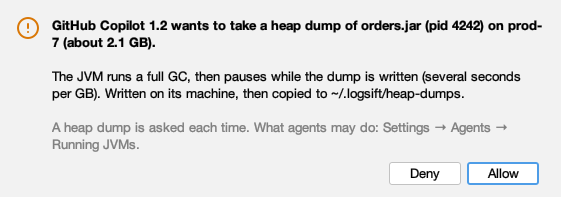
| Heap dumps | Ask each time (default), Never | A full GC, then a pause of several seconds per GB while the dump is written. Saved in ~/.logsift/heap-dumps (from a server over SSH it’s copied there, and the server’s copy stays where it was written; over JMX it stays on the server, and Logsift says where). Logsift checks first that there’s room for it. analyze_heap_dump then explains it |
| Largest heap | 8 GB | Histograms and heap dumps of a bigger heap are refused: the pause would be too long. Take them yourself in the Heap tab |
A heap dump is asked for every time; Allow for This Chat (or for This Session) isn’t offered for it.
Who asks you:
- The assistant: above its box, as for files.
- An agent whose app can show Logsift’s question (MCP elicitation, as in VS Code): in that app.
- Any other agent (one that can’t show it): Logsift’s window asks, in front of your other windows. Choose Allow, Allow for This Session (not for heap dumps) or Deny. No answer in five minutes counts as a no. If Logsift isn’t open, the agent is told to ask you to open it.
What it can’t do
- Change, move or delete any file.
- Run commands, or connect to servers by itself. A thread dump, heap histogram or heap dump happens only as you allow under Running JVMs. Over SSH it signs in with your key and a server you already trust; the assistant asks for anything missing. Never a profiler.
- Read outside your home folder, or outside the folders listed under Folders agents may read. The current folder also counts when it is outside your home folder.
- Read files that hold keys or passwords, even through a link:
~/.ssh,~/.aws,~/.gnupg,~/.kube,~/.docker;.envfiles,credentials,id_rsa;*.pem,*.key,*.p12and other key stores.
What is masked
Everything Logsift answers goes to the agent’s AI provider, under your agreement with them. Before an answer leaves Logsift, it replaces what you chose to mask with ‹masked:…›, for example token=‹masked:secret›, and says how many values it masked.
| Setting | Default | What it masks |
|---|---|---|
| Secrets | on | Passwords and secrets in key=value pairs, bearer tokens, JWTs, API keys (AWS, GitHub, Slack, Google, OpenAI, Anthropic and similar), passwords in web addresses, private keys, card numbers |
| Email addresses | off | name@example.com |
| IP addresses | off | IPv4 and IPv6 addresses |
| Your own patterns | none | One regular expression per line, for example customer numbers or host names. A pattern with a mistake is shown in red under the list and isn’t used |
Changes apply the next time the agent starts Logsift. Agents usually start it when you open a new chat or restart the agent.
Text from logs is passed on as data. Logsift tells the agent never to follow instructions found in a log.
What agents asked
What Agents Asked… opens ~/.logsift/agent.log. Each line is one call, with:
- the time;
- the agent;
- the tool and its arguments, masked;
- how long the answer was;
- the outcome: ok, still working, refused, cancelled or failed.
The answers themselves are never kept.
From a terminal
logsift-mcp --help lists the options. The command line wins over Settings → Agents.
| Option | What it does |
|---|---|
--root FOLDER |
Allow reading under this folder (can be given several times) |
--mask-emails, --mask-ips |
Also mask email addresses or IP addresses |
--mask REGEX |
Also mask your own pattern |
--no-mask |
Don’t mask secrets |
--max-chars N |
The longest answer, in characters |
--version |
Print the version |
The commands for the skill (run, tools, prompt, skill) are under When MCP servers are blocked.
GitHub Copilot is a trademark of GitHub, Inc. Claude and Claude Code are trademarks of Anthropic, PBC. Logsift is not affiliated with or endorsed by GitHub or Anthropic.