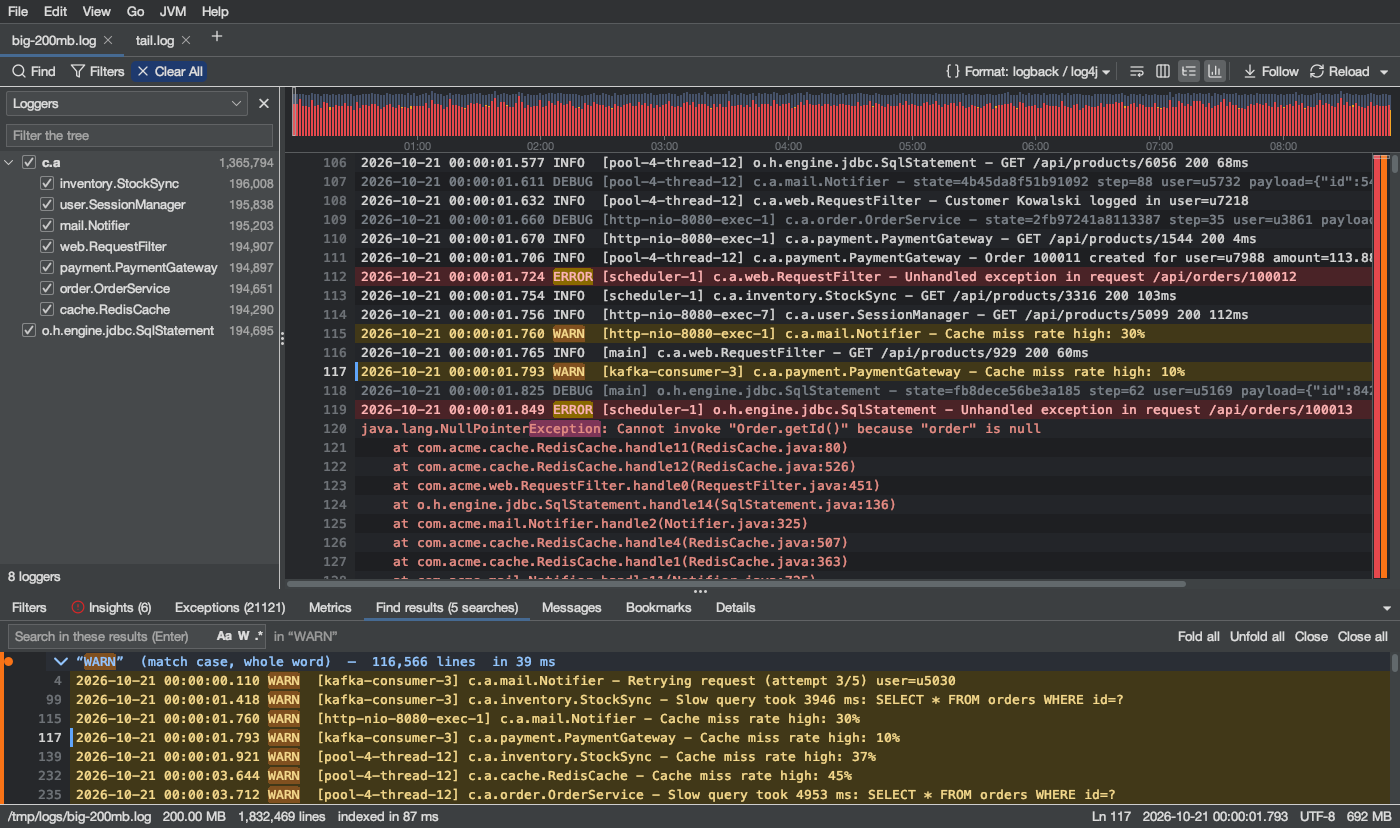
The log view
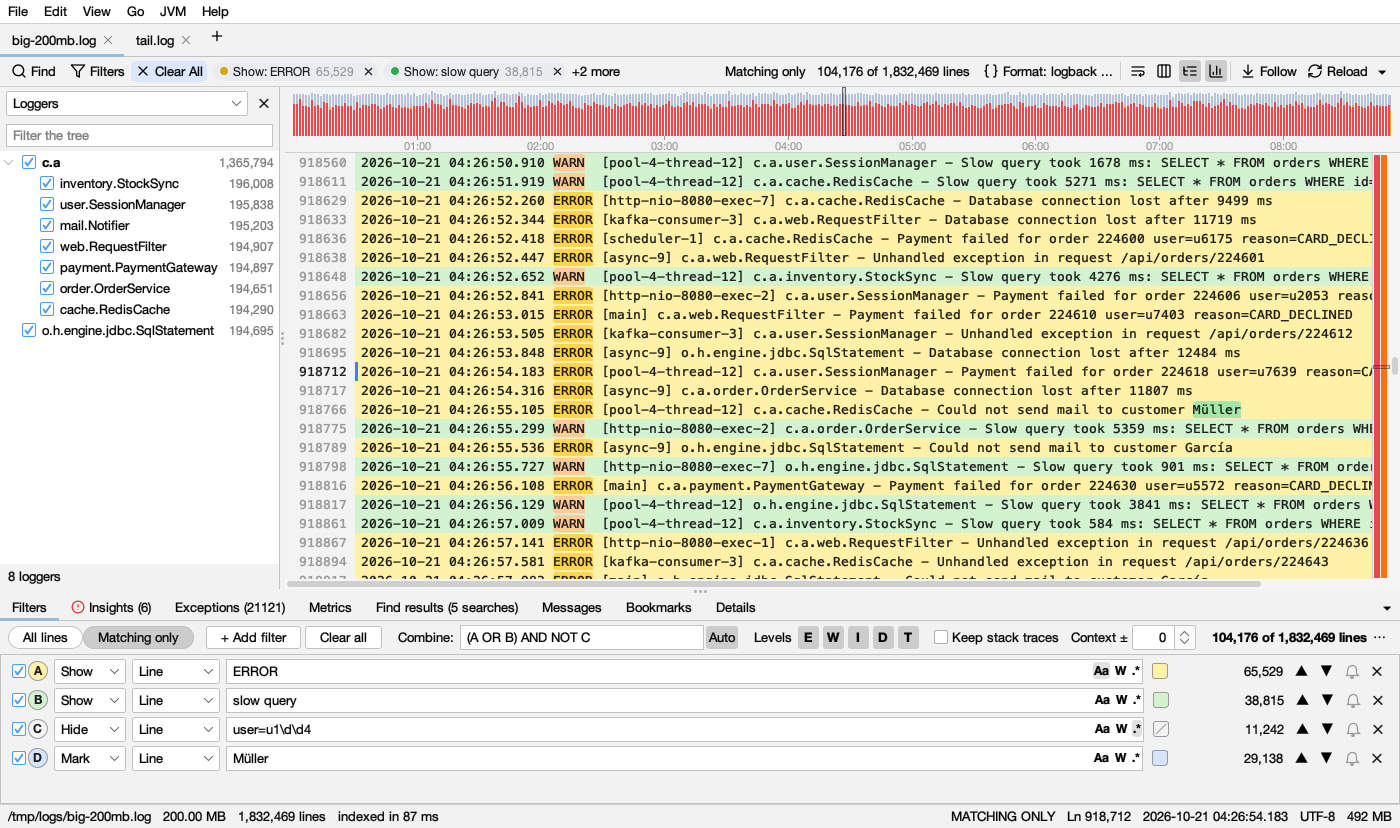
From top to bottom, a log tab has:
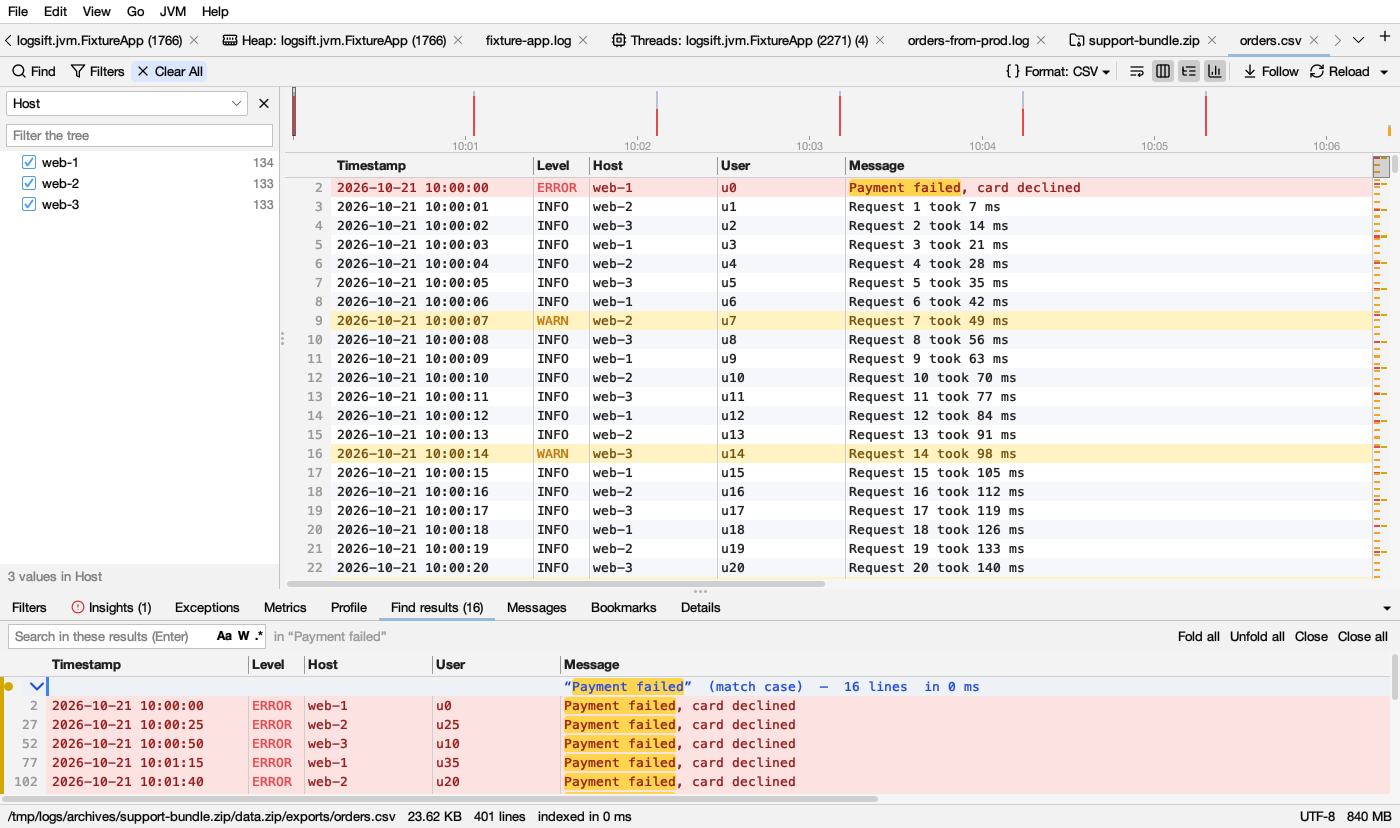
- The log’s bar: Find, Filters, Clear All and the chips of the filters that are on, on the left; the line count, the format and the view buttons on the right.
- The timeline: how much was logged over time.
- The lines, with line numbers on the left and the highlight bar on the right. A tree of loggers can sit on the left.
- The bottom panel with its tabs: Filters, Insights, Exceptions, Metrics, Profile (for CSV files), Find results, Messages, Bookmarks, Details (and Request once you follow one). Ctrl+J (⌘J), the ▾ button, or a double-click on a tab folds or opens it.
- The status bar.
Level colours
Lines are coloured by their level word. The first rule that matches wins:
| Lines with | Light mode | Dark mode |
|---|---|---|
ERROR, FATAL, SEVERE, CRITICAL |
dark red text on pink | pink text on dark red |
WARN, WARNING |
brown text on pale yellow | yellow text on dark olive |
Stack trace lines (at …, Caused by:, ... 5 more, SomeException: …) |
red text | light red text |
DEBUG, TRACE |
gray text | gray text |
INFO and others |
normal text | normal text |
In the plain view, only these words in capitals colour a line. A filter with a colour (see Filters) replaces the level colour on the lines it matches.
In the Columns view the row keeps these colours, and the Level cell is coloured too: red for errors, dark amber for warnings, gray for debug and trace. There, more spellings count: E, ERR, FTL, W, WRN, I, INF, D, DBG, T, TRC, NOTICE, FINE, FINER, FINEST and so on.
Grayed lines ( light gray, in dark mode) are lines your filters leave out, in All lines mode, and context lines around matches. They keep their place so you can see what is around a match.
Line numbers and marks
- Line numbers are gray; the current line’s number is in normal text.
- A blue bar at the right edge of the line numbers marks the current line ( lighter in dark mode). The current line has a pale blue background when nothing else colours it.
- A blue dot by the number is a bookmark.
- A small arrow instead of a number: the line continues from the row above (with Wrap on).
- A dashed line across the view: lines were skipped there (Matching only with Context).
- A coloured stripe at the far left: the source of a line in a merged log.
- Every other line has a faint stripe. Turn it off with View → Line Stripes or in Settings.
- Gray bars that pulse, with Reading from disk…: lines are still being read (a slow or network drive).
Selecting and copying
Drag to select (in a table, cells: see CSV files). Double-click selects a word; triple-click, or a click on the line number, the whole line. Shift+click extends. Ctrl+C copies (with nothing selected, the current line). Ctrl+A selects all.
Right-click a line for: Copy, Bookmark This Line, Follow its request ID, Open … in Editor (on a stack line), Show Thread “…” in Threads, Show Only Lines of Thread “…”, Open the Heap Dump (on an out-of-memory line); with text selected, Find All, Show / Hide / Mark lines with “…”. In the Columns view, right-click a value for Show Only Rows Where Host = web-1 and Hide Rows Where Host = web-1 (see Filters on a column).
The highlight bar
A narrow bar beside the scrollbar shows the whole file at a glance, in two lanes:
- Left lane: red marks for errors and amber marks for warnings (the same in both modes). Red wins where both are.
- Right lane: blue for bookmarks, each Find All search in its colour, the find bar’s matches in dark yellow, and each filter with a colour in that colour.
- A see-through box shows the part of the file on screen.
Click a mark to jump to its line; hover to see it. F8 / Shift+F8 go to the next or previous error. Only lines the view shows get marks.
The log’s bar
Left: Find (Ctrl+F), Filters (opens the Filters tab), Clear All (lit while anything is set: back to the whole log), the chips (see Filters) and Matching only.
Right: the count (1,234 of 50,000 lines), then:
| Button | Does |
|---|---|
| Format: …▾ | How the lines are read, for example Format: CSV ▾ or Format: logback / log4j ▾. Click it to choose another format for this file (it is remembered), Plain text, New Format from This Log… or Edit Log Formats…. The same list is in View → Log Format. In a narrow window it shows just the name (CSV ▾); hover it for the whole name |
| Wrap | Wrap long lines (Alt+Z, ⌥Z). A table (CSV, TSV) never wraps: it scrolls sideways, to its last column |
| Columns | Show lines as columns (Ctrl+Shift+K) |
| Tree | The tree of loggers (Ctrl+Shift+B) |
| Timeline | Show or hide the timeline |
| Follow | Follow the end of the file as it grows, like tail -f (Ctrl+T, or End) |
| Reload | Load what changed in the file (F5). It turns into an amber pill, Reload (+1.23 MB) or Reload (file replaced), when the file changed |
| ▾ | Reload Automatically: load changes as they happen. Follow turns it on |
These apply to this log, and your last choice becomes the default for the next log you open.
The status bar
Left: the file (or sftp user@host:/path, or the web address), its size, the number of lines and how fast it was indexed. Then, when it applies: • 1.2 MB more on disk: Reload (F5) to see it, • the file was replaced on disk, or the state of a remote connection (⚡ …). A blue button appears when a new version of Logsift is out.
Right: MATCHING ONLY, the line number (Ln 1,234), the current line’s time, FOLLOW, the text encoding, and the memory Logsift uses.
Columns
Columns (View → Columns, Ctrl+Shift+K) shows lines as columns: Time, Level, Thread, Logger, Message, or whatever the format has (host, process, status, …). Logsift knows logback and log4j, Spring Boot, Python logging, .NET’s Serilog ([ERR]), NLog (time|LEVEL|logger|message), log4net and ASP.NET Core’s console (fail: Category[event], the message on the next line), syslog, web access logs and JSON lines; levels written their own way (ERR, WRN, fail, crit) count as errors and warnings in Levels and everywhere else. Stack traces show under the message. A table (a CSV or TSV file) opens with Columns on. Turning them off in a table is remembered for tables, apart from logs. A title longer than its column is cut with “…”: hover it, or widen the column, to read all of it.
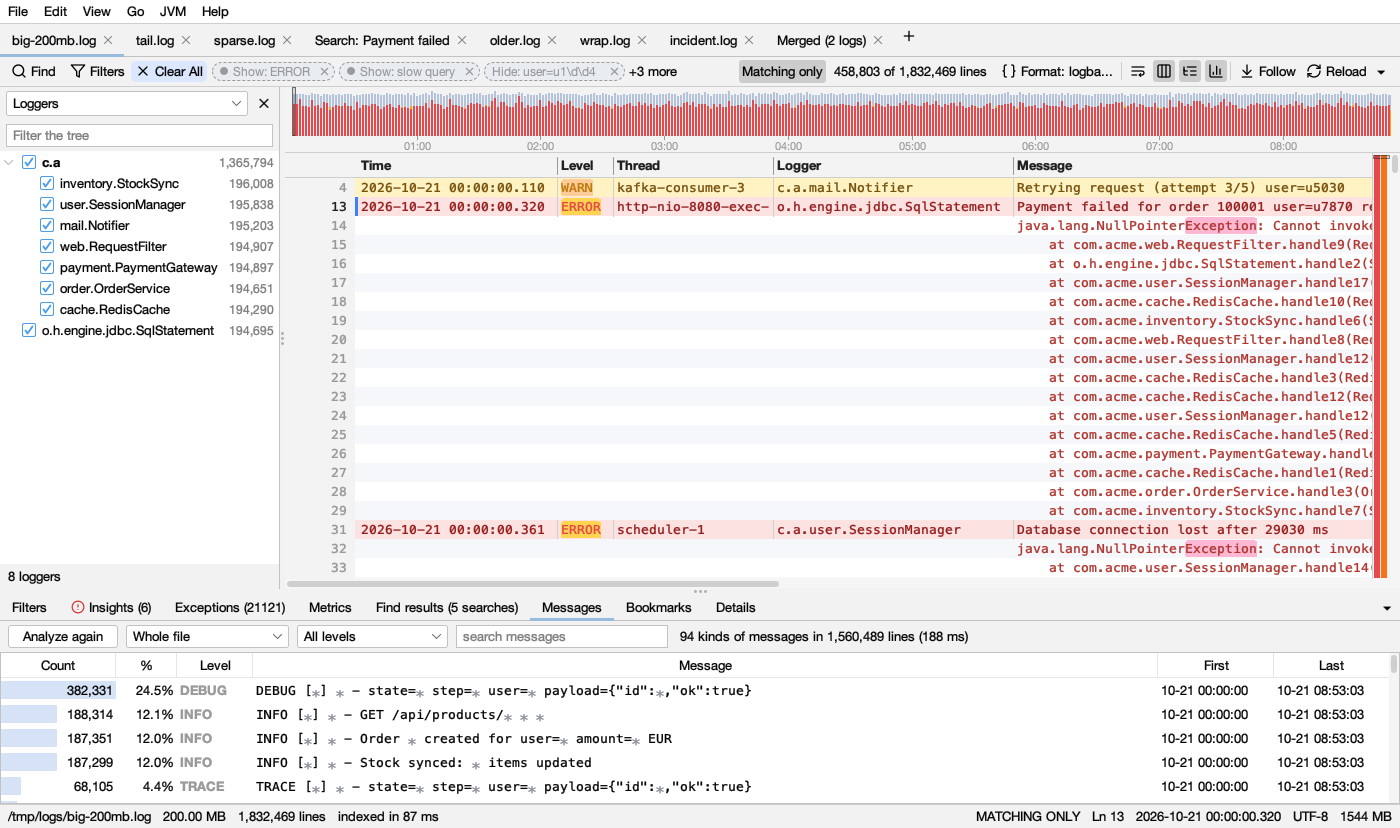
- Drag a header edge to resize a column.
- Right-click a header: Count Values in … (every value with its number of lines; double-click one, or Show Only, to see its rows, or Hide them), Filter by … (a filter that looks only in that column, see Filters on a column), Profile of the Columns (the Profile tab), Hide … Column, tick columns on and off, Show All Columns.
- Right-click a value: Show Only Rows Where Host = web-1 or Hide Rows Where Host = web-1. A crossed-out eye with a number, at the left of the header above the line numbers, says how many are hidden; click it to show which, and show them again; hidden columns are remembered for each format.
- When Logsift doesn’t know the layout, it says “Logsift doesn’t know this log’s layout, so it can’t show it as columns” and offers Define Its Format… (see Settings).
JSON logs
Logs with one JSON object per line are recognized. With Columns on, the usual fields become columns (@timestamp/timestamp/time/ts → Time, level/severity → Level, thread, logger, message/msg) and the rest go together in a Fields column as key=value.
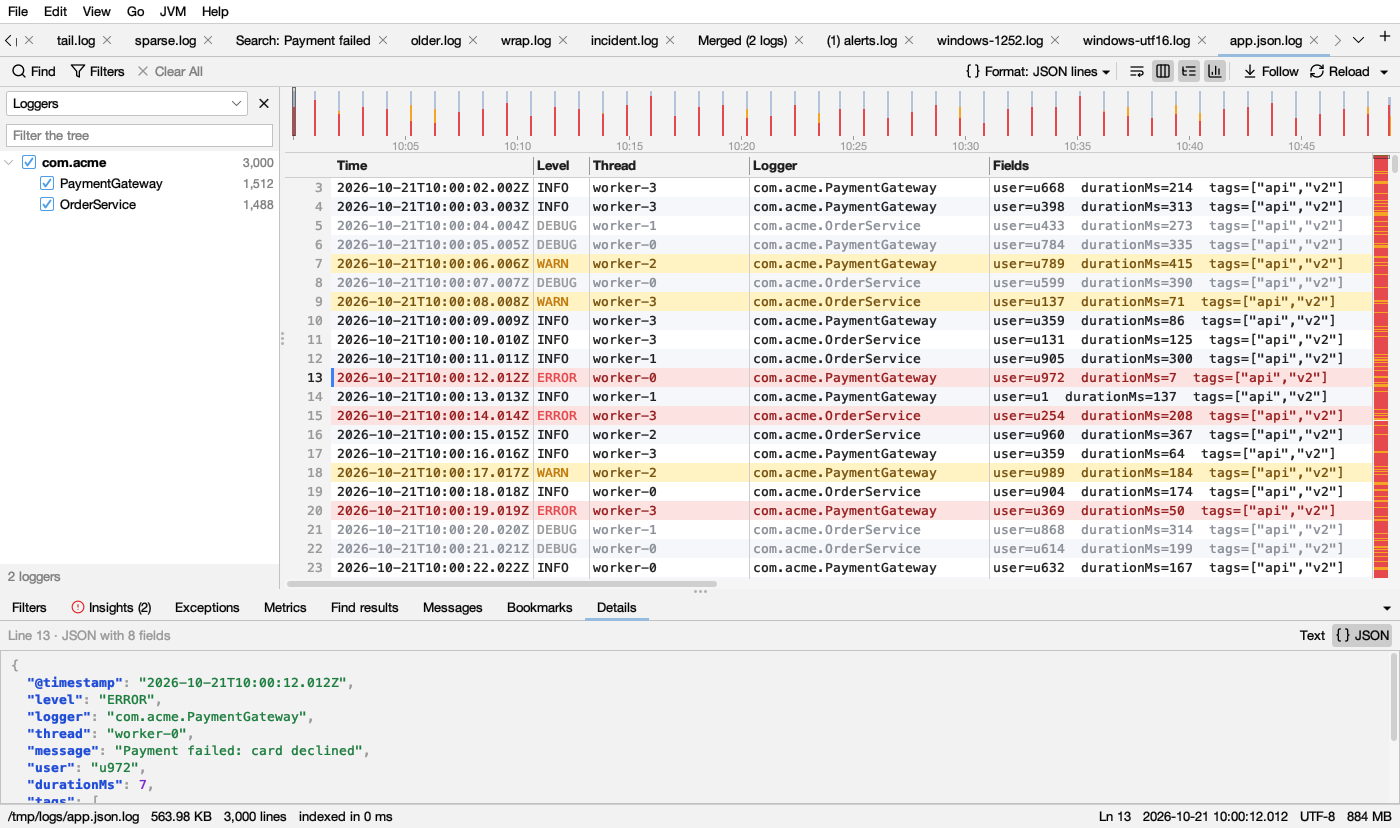
| The Details tab shows the current entry in full (a line with its stack trace), or just the text you selected. Its **Text | JSON** switch pretty-prints the JSON in it, also JSON in the middle of a message and JSON written inside strings. JSON colours: |
| Part | Light | Dark |
|---|---|---|
| Keys (bold) | blue | light blue |
| Strings | green | light green |
| Numbers | purple | light purple |
true, false, null |
orange | light orange |
{ } [ ] , : and text around the JSON |
gray | gray |
CSV files
A .csv or .tsv file is read as a table: the header row names the columns, and rows are split by comma, semicolon, tab or |, with quoted fields handled. Columns named like a time, level, thread, logger or message (timestamp, severity, msg…) are used as such: the timeline uses the time column, and levels colour the rows. Other columns appear in the tree beside the log. Other files are read as CSV when they clearly are one, or choose CSV in Format: …▾ in the log’s bar.
A quoted value may hold line breaks ("line one on one line, line two" on the next): the row is still one row, its cells shown on its first line and the lines it goes on over shown as they are, and Profile, Pivot, Values, Metrics, filters on a column and Query count it once. Rows of any length are read whole, so a table with thousands of columns has all of them, however long its rows (a line on screen shows the first 64 KB of a line; a table’s cells come from the whole row).
Exports with a title, totals or empty columns. A downloaded report often doesn’t start with its header: a title (Monthly sales report), a note (Exported:,2026-05-01) or a row of separators comes first. Logsift takes the first line that reads as a header (names, as many as the rows have values) within the first 20 lines; the lines above it show grayed and aren’t rows. Right-click a row for:
- Use This Row as Header, when Logsift took the wrong line: its values name the columns, and the lines above it aren’t rows. (One of the first 2,000 lines.)
- Ignore This Row, for a totals or summary line, or anything else that isn’t a row of the table: it shows grayed and is left out of filters on a column, Profile, Pivot, Metrics, Query, Compare and merged CSV files. Don’t Ignore This Row takes it back.
- Reset Header and Ignored Rows goes back to what Logsift found.
These are kept for the file. Empty columns (no value in any row: the extra separators some exports add at the end of each line) are hidden; the crossed-out eye at the left of the header lists them, marked (empty), to show them again. Tables over 512 MB aren’t read for empty columns.
The header and the rows needn’t have the same number of fields. Names can have spaces and values can be empty. A header can name a column that no row fills, such as an empty last column some exports add: it’s still a column, and it stays empty. A separator at the end of the header names nothing, so it adds no column. When rows have a value past the header’s last name, that value gets its own column, called column 5 for example. All of this works in Profile, Pivot, Values and Query.
- In the Columns view the header row isn’t shown as a row: its names are the column titles. Line numbers are those of the file, so the first row is line 2. The titles are the header’s names as written (order_id, timestamp), in the tree, the filters and their chips too. Logsift still knows which column holds the time, level, thread, logger or message (timestamp, severity, msg…): hover such a title to see it. This is also true of a header longer than a line is shown (64 KB, thousands of columns): its names are all column titles. The plain view shows the header line as it is.
- A table is a grid of cells. A click selects a cell; Shift+click or a drag selects a block of them, and the arrow keys move (with Shift, grow the block). Ctrl+C (⌘C) copies the cells as tab-separated text, ready to paste into a spreadsheet. A row over several lines is one row, and a value with a tab, line break or quote is quoted. A click on a line number still selects whole lines, and a double-click selects a word.
- Right-click a value to show only (or hide) the rows with it, or a column title for Filter by …: see Filters on a column.
- The Profile tab shows what each column holds, with a chart per column. The Messages tab groups rows by the message column (a table without one has no messages to group). The Metrics tab charts the columns of numbers, and how many rows each value of a column like host or status has over time.
The tree of loggers
Logs with a logger column (or class, component, thread, host…) can show a tree on the left (Tree, Ctrl+Shift+B). com.acme.db.Pool sits under com.acme › db, with line counts.
- Uncheck a branch to hide its lines and their stack traces. A half-checked box means part of a branch is hidden. Hidden names are grayed.
- Double-click a name (or right-click → Show Only) to see only that one; Show all brings everything back.
- The list at the top picks the column. Filter the tree finds a name.
- Hiding anything switches the log to Matching only, and adds a chip Tree: N hidden. What you hid is remembered for the file.
- The ✕ at the top hides the tree. While it’s hidden, a narrow strip at the left edge reads Tree · Loggers (or the column’s name, such as host); click it to bring the tree back.
Bookmarks
Ctrl+F2 (⌘F2) bookmarks the current line, or right-click → Bookmark This Line. F2 / Shift+F2 go to the next or previous one. Bookmarks show as blue dots by the line number and on the highlight bar.
The Bookmarks tab lists them: Line, Time, Note (type a note there) and Text. Double-click to go there; Delete removes one. Bookmarks are remembered per file, and dropped when the file was truncated (the lines would have moved).
Merged logs
A log made with File → Merge Files by Time… starts each line with a label like <node2-app> and a coloured stripe at the far left. See Compare and merge. CSV files merge into one CSV with a Source column instead: see Merge CSV files.
Text encodings
Logsift detects UTF-8 (with or without a byte order mark), UTF-16, and Windows-1252. The status bar shows the encoding. View → Encoding reopens the log in another one (Latin-1, Cyrillic, Shift_JIS, GB18030 and more). The encoding for text that isn’t UTF-8 is set in Settings.
Font and dark mode
Ctrl+= / Ctrl+- change the font size; View → Dark Mode switches the theme. The font itself is in Settings.